The FARM Observatory
The Observatory analyzes and compares public support for agriculture and food around the world.
Three key indicators are analyzed: the public expenditure to support agriculture and food, THE market price support and the full support for agriculture and food.
THE first part of these analyses concerns the key elements to remember about public spending in the world and more specifically in sub-Saharan Africa. The second part is devoted to the study of market price supports, and finally the last part dedicated to the analysis of total support.
Discover recent analyses on the Observatory's 3 main indicators
After going online in 2022, the FARM Foundation's Global Observatory of Public Support for Agriculture and Food is undergoing new developments, with the release of new data! After the first analyses published, FARM offers an in-depth and renewed look at state interventions in the field of agricultural and food support. How much and in what forms do states spend to support their agricultural and food sectors, but also what support gaps can be observed between countries?
The Observatory offers new analyses based on updated data from recognized sources (OECD, IDB, MAFAP-FAO) and is enriched by the addition new countries [1] thanks to data from the MAFAP program. It allows for a more detailed analysis of trends and gaps in support between countries, providing decision-makers and stakeholders in the agricultural sector with essential understanding to design more effective and fair support policies.
The Observatory now covers 45 high-income countries, 39 middle-income countries, and 9 low-income countries, together accounting for more than 90% of the value of global agricultural production. Data spans from 1986 to 2022, depending on the country.
The Observatory's analyses continue to be structured around three key indicators: Public expenditure on support for agriculture and food, THE Market price support (measures creating a gap between the domestic price and that of international markets), and the Full support for agriculture and food (link to the methodological note). This first part of the FARM Observatory's analysis focuses on public spending to support agriculture.
[1] The new countries are: Mauritania, Niger, Nigeria, Seychelles and Bangladesh
The amount of global public spending directed towards supporting agriculture and food, calculated on the average of the last three known years, amounts to to more than 542 billion US dollars (USD). Nearly 90 % of this amount is concentrated in four major regions: in the lead East Asia (130 billion), North America (125 billion), South Asia (119 billion), and Western and Central Europe (106 billion) (graph 1).
Chart 1
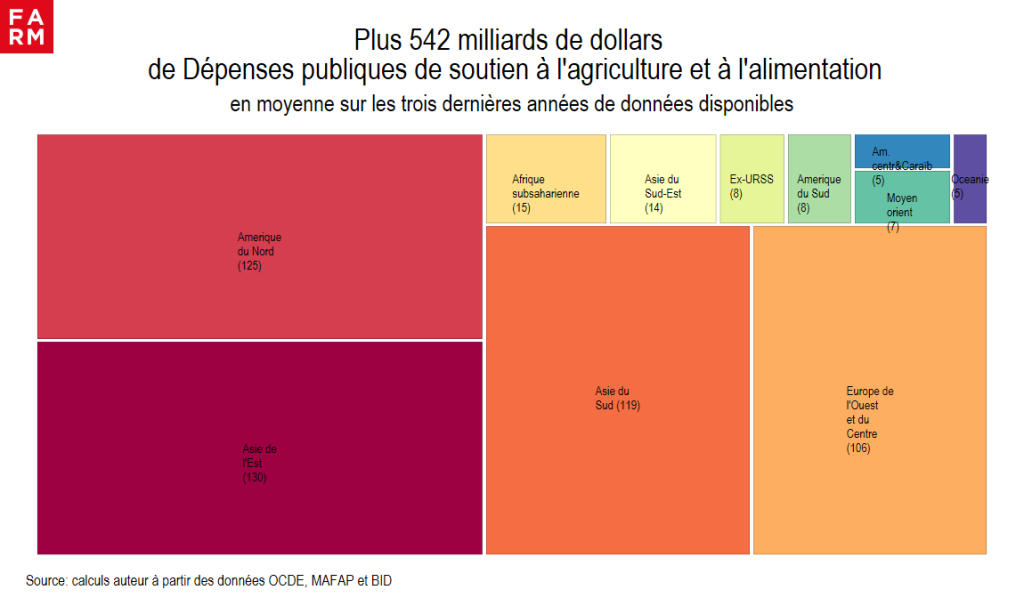
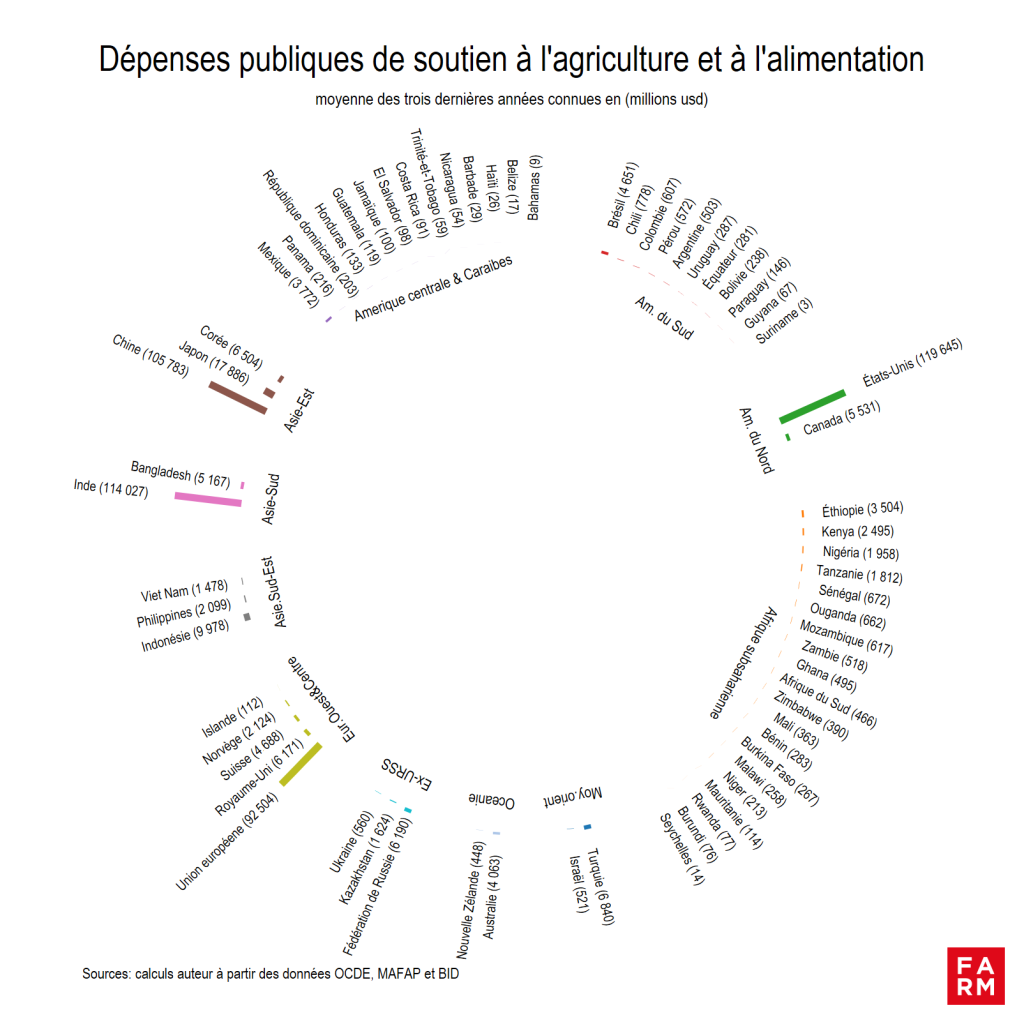
Chart 2 presents the details of these expenses calculated on the average of the last three years by country and expressed in millions of USD within 11 regional groupings. In East Asia, China is the country that spends the most to support its agriculture with more than , representing a major share of public support spending in this region. In North America, the United States dominate with USD 119 billion, followed by Canada with 5.5 billion USD. For South Asia, India is the largest contributor with USD 114 billion. The bloc formed by the European Union occupies an important place with 92.5 billion USD, followed by United Kingdom (6 billion USD).
As the graph shows, Brazil, Mexico, Ethiopia, Turkey, Russia, Australia and Indonesia are the countries that spend the most to support the agricultural and food sectors in their respective sub-regions.
Chart 2
The gaps in public spending on agricultural support between major regions (East Asia, North America, South Asia, Western and Central Europe) and the rest of the world are considerable. These differences reveal profound differences in fiscal capacity and strategic priorities between countries. The richest and most industrialized regions allocate much larger sums to support their agricultural sectors, while lower-income regions, such as sub-Saharan Africa, have limited means to finance this type of support, even though agriculture is a key sector of their economies and food insecurity remains a serious public problem.
Over the past two years (see the analyses of the FARM Foundation), global public spending on agriculture and food support has changed little. The global panorama remains dominated by rich, industrialized countries, which, although less dependent on agriculture, invest more in this sector.
These disparities make comparisons between countries and regions difficult if we consider only the gross amounts of public spending. To facilitate comparisons, we will relate these amounts to the value of each country's agricultural production. This makes it possible to measure the intensity of support, or in other words, the financial effort made by a state, regardless of its level of wealth, to support its agriculture.
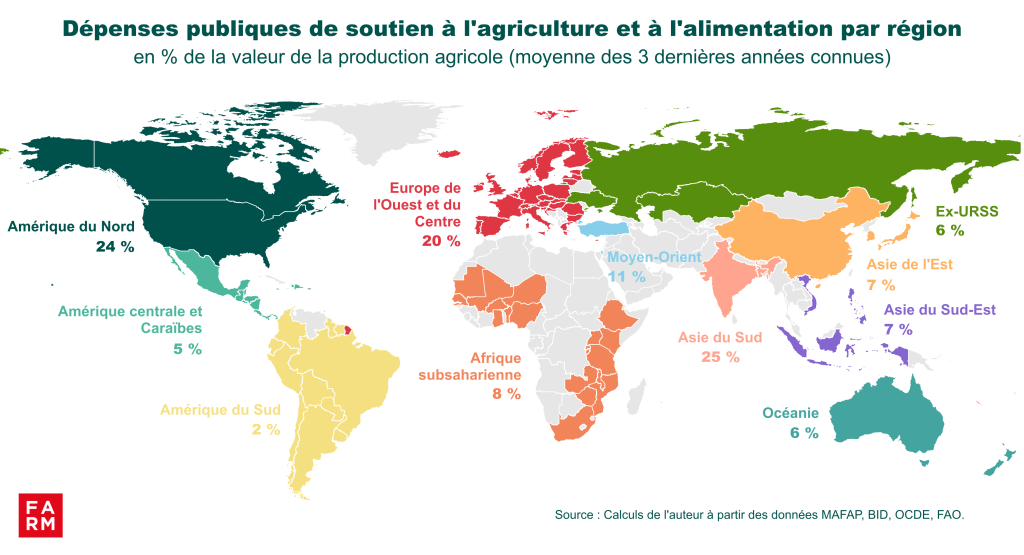
When compared to the value of agricultural production, the analysis of public expenditure also shows significant differences in the intensity of support between countries and regions. At the global level, the financial efforts made by governments to support agriculture represent on average 14% of the value of global agricultural production. Regions such as North America, South Asia, and Western and Central Europe stand out for their strong financial commitment to agriculture. (graph 3). Indeed, South Asia has one of the highest rates of public agricultural expenditure, representing 25% of the value of its primary production.. Just behind South Asia, North America devotes 24 billion of the value of its agricultural production to finance its agricultural sector. With support of 20 billion, Europe also stands out for its financial commitment to agriculture. However, it should be noted that the 2003 reform of the Common Agricultural Policy (CAP), implemented in the following years, led to a reduction in public agricultural spending. This decrease is explained in particular by the decoupling of aid, previously linked to agricultural production. Thus, public agricultural spending fell from 27 billion of the value of agricultural production in 2006 to only 17 billion in 2022.
Conversely, regions such as Sub-Saharan Africa (8 %) or South America (2 %), despite a significant dependence on agriculture for economic growth and food security, show lower support, due to budgetary constraints and/or strategies oriented towards other support mechanisms, notably through the market.
Chart 3
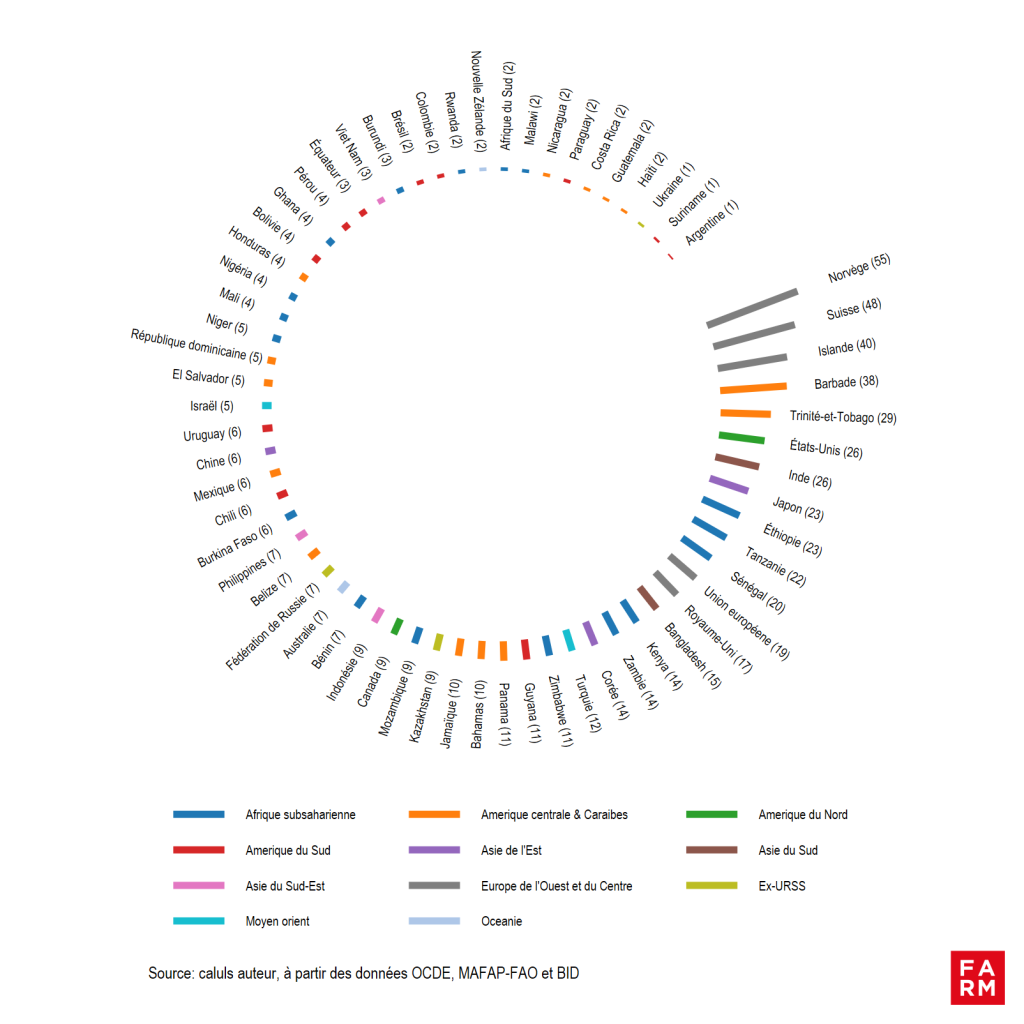
THE graph 4 presents a detailed view of the efforts made by each country to support their agriculture, expressed as a percentage of agricultural production. Norway, Switzerland, and Iceland stand out with high levels of support, reaching 55 %, 48 %, and 40 % of agricultural production, respectively. Among the major agricultural economies, the United States and India also show significant support, each at 26 %. Some countries in sub-Saharan Africa also show notable public commitment. In Ethiopia, Tanzania, and Senegal, governments devote 23 %, 22 %, and 20 % of the value of their agricultural production to support the sector, which demonstrates a significant financial effort for these countries compared to other countries in the region. In contrast, China, which accounts for nearly 20 billion USD of the global public expenditure on agriculture, has significantly lower relative support, representing only 6 billion USD of the value of its agricultural production, an intensity half that of the global average.
Chart 4: Detailed overview by country: Public expenditure on support for agriculture and food in each country, in % of the value of agricultural production
3/5 of global public expenditure on support for agriculture and food is budgetary transfers encouraging production or intended for producers
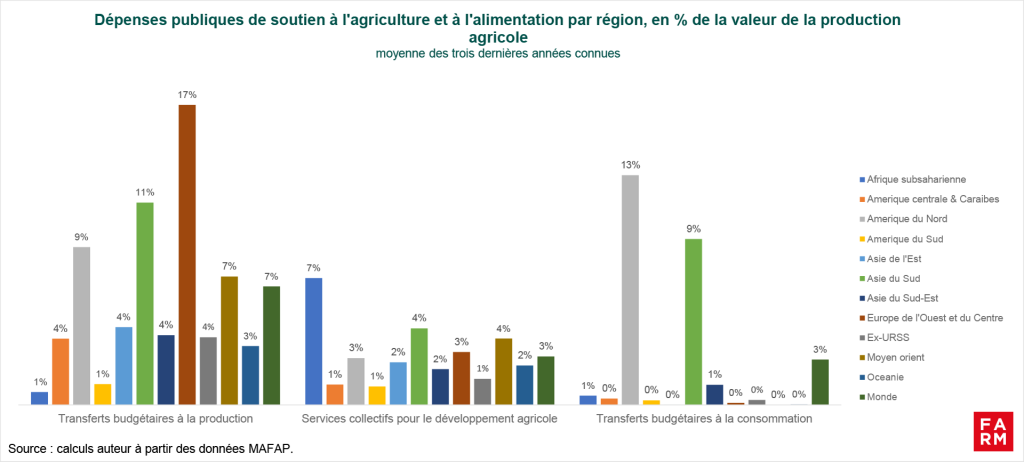
Public support expenditure is divided into three main categories: budgetary transfers to production, budgetary transfers to consumption and collective services (infrastructure, training, research and extension, etc.) for agricultural development. (chart 5)Each region has its own priorities and adopts distinct strategies. Public expenditure analysis allows us to account for these options and objectives: directly supporting production, competitiveness and producers' income; making agricultural products more affordable for consumers; or investing in the development of rural infrastructure and services dedicated to agricultural development. The distribution of expenditure therefore reflects different priorities that respond to the specific needs of the countries but also to the legacy of public agricultural policies, as indicated by the debates relating to the reforms of the Common Agricultural Policy within the EU.
For example, the United States devotes more than half (55 %) of its public agricultural expenditures to consumer support. The objective is to guarantee more affordable agri-food products for consumers, notably through large food subsidy programs such as SNAP (Supplemental Nutrition Assistance Program), better known as Food Stamps, or the National School Lunch Program. These policies indirectly contribute to supporting agricultural production. Transfers to production are also significant, accounting for 35 % of expenditures devoted to the sectors, while collective services for agricultural development are relatively low (10 %). Across the border, in Canada, only 2 % of agricultural expenditures are devoted to consumption; the rest is directed overwhelmingly towards production (65 %) and collective services (33 %).
In South Asia, the approach can also vary from one country to another. India devotes 46 billion and 39 billion of its agricultural expenditures to encouraging consumption and production, respectively. Bangladesh, for its part, prioritizes support for collective services (62 billion of expenditures), while fiscal transfers to production represent 31 billion.
In Western and Central Europe, priority is generally given to transfers to production, which represent 85 % of agricultural expenditure, showing direct support to agricultural producers through aid from the Common Agricultural Policy for European Union countries. Collective services for agricultural development are limited to just under 15 %, while there are practically no transfers oriented towards consumer support.
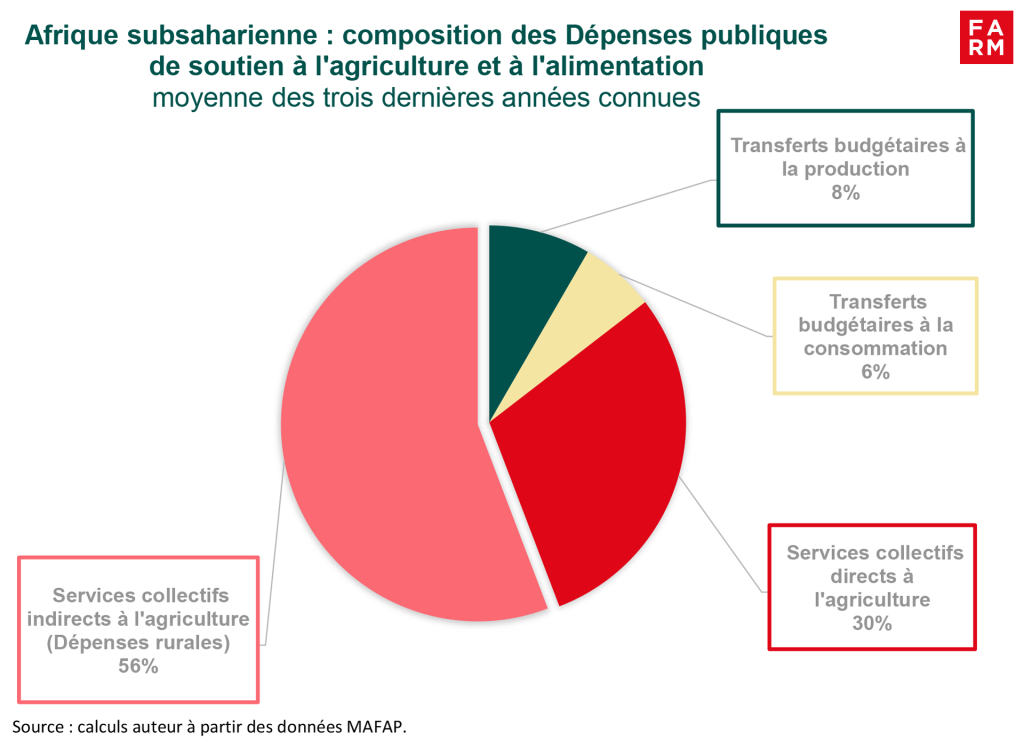
In sub-Saharan Africa, the bulk of public spending (nearly 90 %) is directed towards collective services for agricultural development. This shows an approach focused on infrastructure and the general development of the sector rather than on direct subsidies to production or consumption. These expenditures are certainly necessary but constitute indirect support to production composed mainly of rural service expenditures (health, education, roads, etc.) as we showed in the analysis published in 2022 (find the 2022 analysis here).
Chart 5:
As in other regions, public expenditures in support of agriculture and food have changed very little in sub-Saharan Africa. Furthermore, the detailed data available for this region are relatively sparse and concern mainly West and East Africa. Thanks to the efforts of FAO's MAFAP Programme, the number of countries covered has increased to 19 with the addition of Mauritania, Niger, Nigeria, and Seychelles.
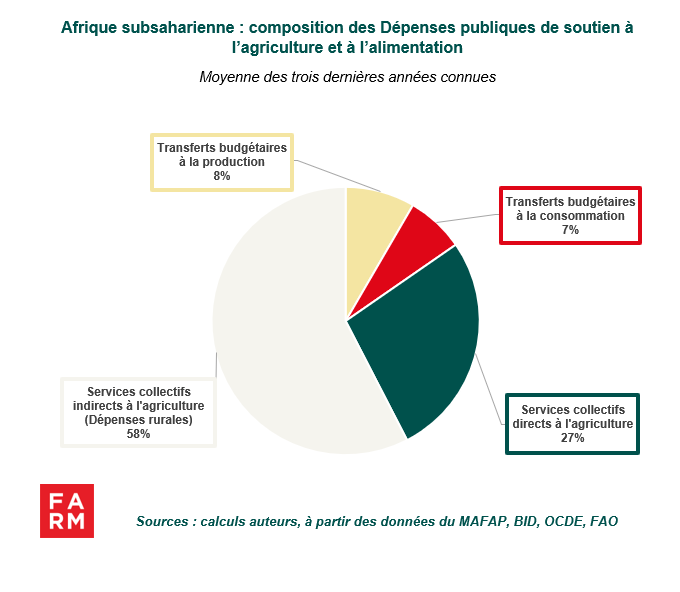
The bulk of public expenditure on public support for agriculture and food in sub-Saharan Africa remains overwhelmingly oriented towards the provision of collective services for the development of the agricultural sector and rural areas. Collective services represent 86 % of total agricultural budgetary expenditure, but two-thirds (56 %) of this expenditure does not directly target the agricultural sector. This includes, for example, rural expenditure on health, education, infrastructure, etc. However, this rural expenditure is essential and contributes indirectly to the development of the agricultural sector, as the majority of rural populations work in this sector. (chart 6).
Transfers targeting production are low (8 %) and the trade policies implemented reduce or even cancel out the effects of support to producers. These trade policies are often oriented towards maintaining affordable food for consumers (see previous analyses on urban bias). These trade policies favor imports of food products whose prices are more competitive than those of local products. In some countries such as Rwanda or Mali, budgetary transfers granted to producers do not compensate for the negative effects of trade policies (the third part of the Observatory's analyses on Total Support will return to these cases in detail).
Chart 6
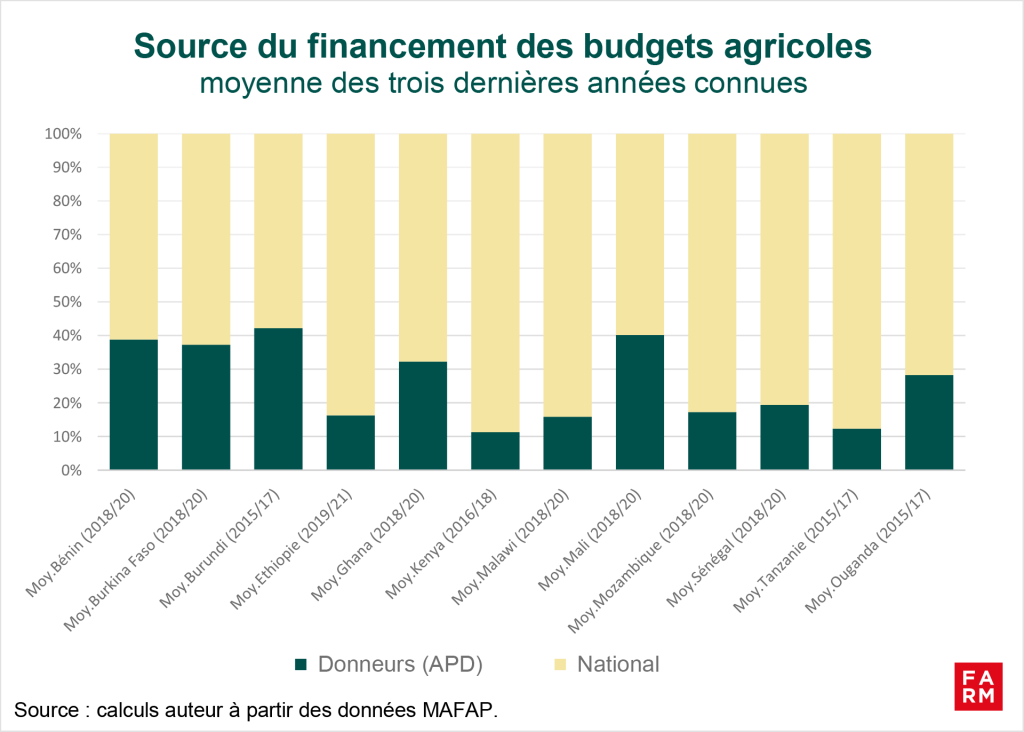
Furthermore, as indicated by the graph 7, it is important to note a certain dependence of agricultural budgets on international aid. Between 10 and 40 % of agricultural expenditures come from the support of donors and technical and financial partners. Such dependence can harm the efficiency and sustainability of agricultural strategies in different countries, particularly in a context marked by donor budget constraints.
Indeed, a strong trend towards disengagement is underway today, particularly in France, where the Barnier government is planning a 34% reduction in resources allocated to official development assistance (ODA). While the planned reduction is the most significant in France, other European countries have initiated this decline, such as Germany, Finland, and Great Britain. These northern countries were among the few wealthy economies to achieve the United Nations target of 0.7% of gross national income dedicated to ODA. The European Union, which is also a major donor, will also reduce its support to vulnerable countries, with a planned 35% reduction in its allocations to the Least Developed Countries over the period 2025-2027 compared to the previous period.
Chart 7
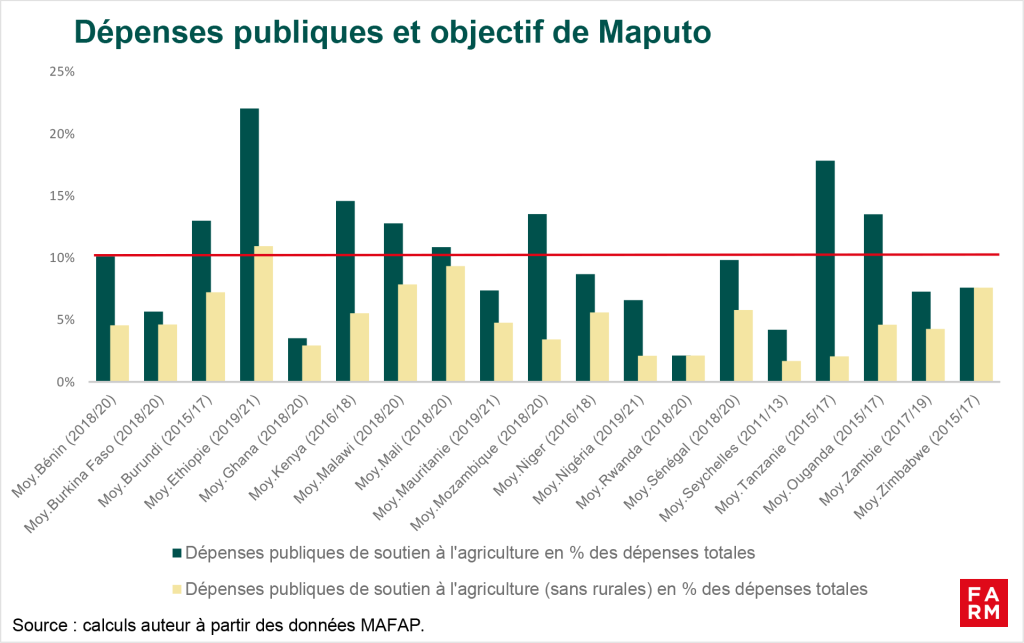
In 2003, at the Maputo Summit in Mozambique, African Union heads of state committed to allocating at least 10 billion of their public budgets to the agricultural sector, with the ambition of achieving annual growth of 6 billion. The leaders sought to position the primary sector as a driver of the continent's economic and social development. This commitment, made under the Comprehensive Africa Agriculture Development Programme (CAADP), was renewed in 2014 in Malabo, Equatorial Guinea.
However, fiscal realities show that many countries are struggling to meet this commitment. According to the MAFAP data we analyzed, out of 19 countries, only 9 have met the minimum target of 10,% of public spending on agriculture and food. Excluding rural spending, which is considered indirect support to the agricultural sector, only Ethiopia is fully meeting its commitments to the Maputo target. (chart 8)These data lead, in fact, to questioning the means implemented as well as the commitment and willingness of African States to effectively support their agriculture.
From January 9 to 11, 2025, Kampala will host the Extraordinary Summit of Heads of State and Government of the African Union. This summit will be dedicated to the adoption of the new CAADP Strategy and Action Plan for the period 2026-2035. This meeting represents a crucial opportunity for member states to reaffirm their commitment to agricultural development and define concrete actions to achieve the set objectives. It is imperative that the discussions result in solid financial commitments and rigorous monitoring mechanisms to transform promises into tangible achievements for the African agricultural sector.
Chart 8
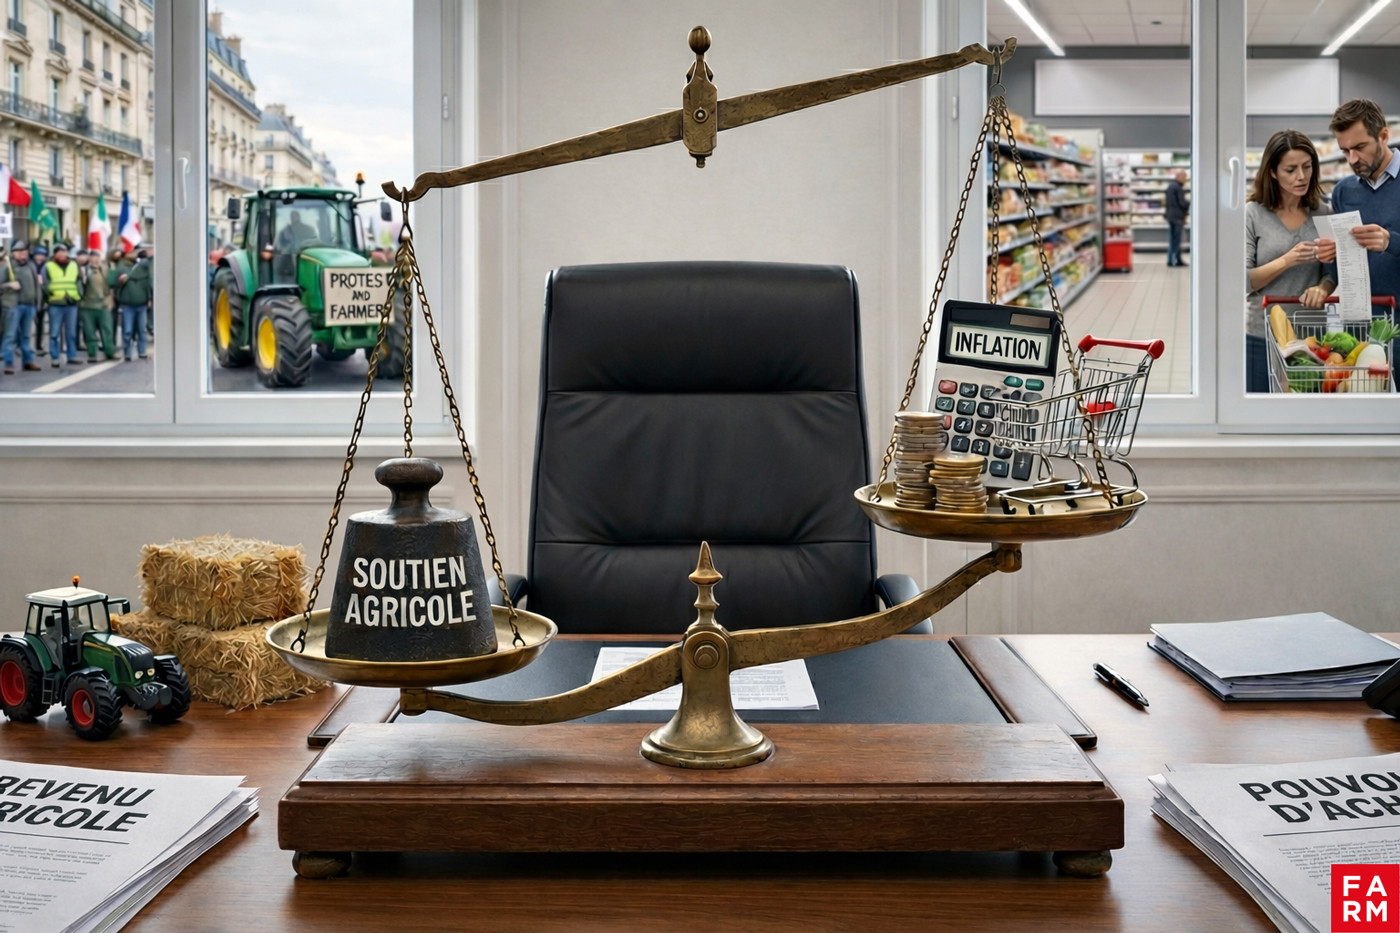
Market Price Support (MPS), The non-budgetary channel of public agricultural support reveals major trade-offs. Between supporting producers and protecting consumers, it paints a picture of a profoundly unequal agricultural world, where prices favor some and tax others.
After deciphering budgetary expenditures in our previous section, the Global Observatory of Public Support for Agriculture and Food focuses on the second pillar of agricultural support: Market Price Support (MPS). If budgetary expenditures are the tip of the iceberg, the SPM (Strategic Performance Management) constitutes the submerged part. Less visible in state budgets, it is nonetheless crucial for the farmers' income, food safety and the competitiveness of sectors around the world.
Before delving into international comparisons, it is essential to understand what Market Price Support (MPS) actually measures. This often technical concept nevertheless sheds light on an entire area of agricultural policy that falls outside the scope of public budgets. This section lays the groundwork: how MPS works, what it reveals, and why it is indispensable for analyzing price distortions.
Unlike government spending (DPAA), which is actual disbursements from the government, SPM is an economic estimate of what the market transfers as a result of government policies. It measures the difference between the domestic price received by a farmer for his production and a reference price linked to international trade, adjusted to be comparable to the price observed on the domestic market. This discrepancy is not the result of chance, but the direct consequence of public policies: customs duties, import quotas, guaranteed prices or, conversely, export taxes and price control.
While public spending measures the budgetary effort of states, Market Price Support (MPS) measures the impact of trade and regulatory policies on the prices paid to producers. It thus reflects the extent of distortions induced by public policies on domestic agricultural markets.
The analysis of the SPM is essential because it highlights two major trends in agricultural policies. On the one hand, some countries support their producers by maintaining high domestic prices. On the other hand, price policies result in an implicit taxation of agriculture, either to contain food prices or to capture public revenue from exports.
This diversity is reflected in the value of the SPM, which can be positive, negative, or close to zero. Each of these configurations has distinct implications for farm incomes, access to food, and international competitiveness:
Globally, net transfers related to SPM reach approximately 168 billion USD, according to estimates produced by the FARM Observatory, which mobilizes and aggregates — over the last three years available — data from the OECD, the IDB/IDB and the MAFAP.
However, this global average is misleading, as it results from diametrically opposed national policies, the effects of which can cancel each other out in the aggregate. To understand the reality of the dynamics at play, it is necessary to examine more closely the nature and extent of the distortions. (Graph 1).
Price policies are not evenly distributed around the world. Some regions provide massive support to their producers, while others implicitly tax their agriculture. This section reveals the major geographical areas and dynamics that are currently reshaping the global map of agricultural price support.
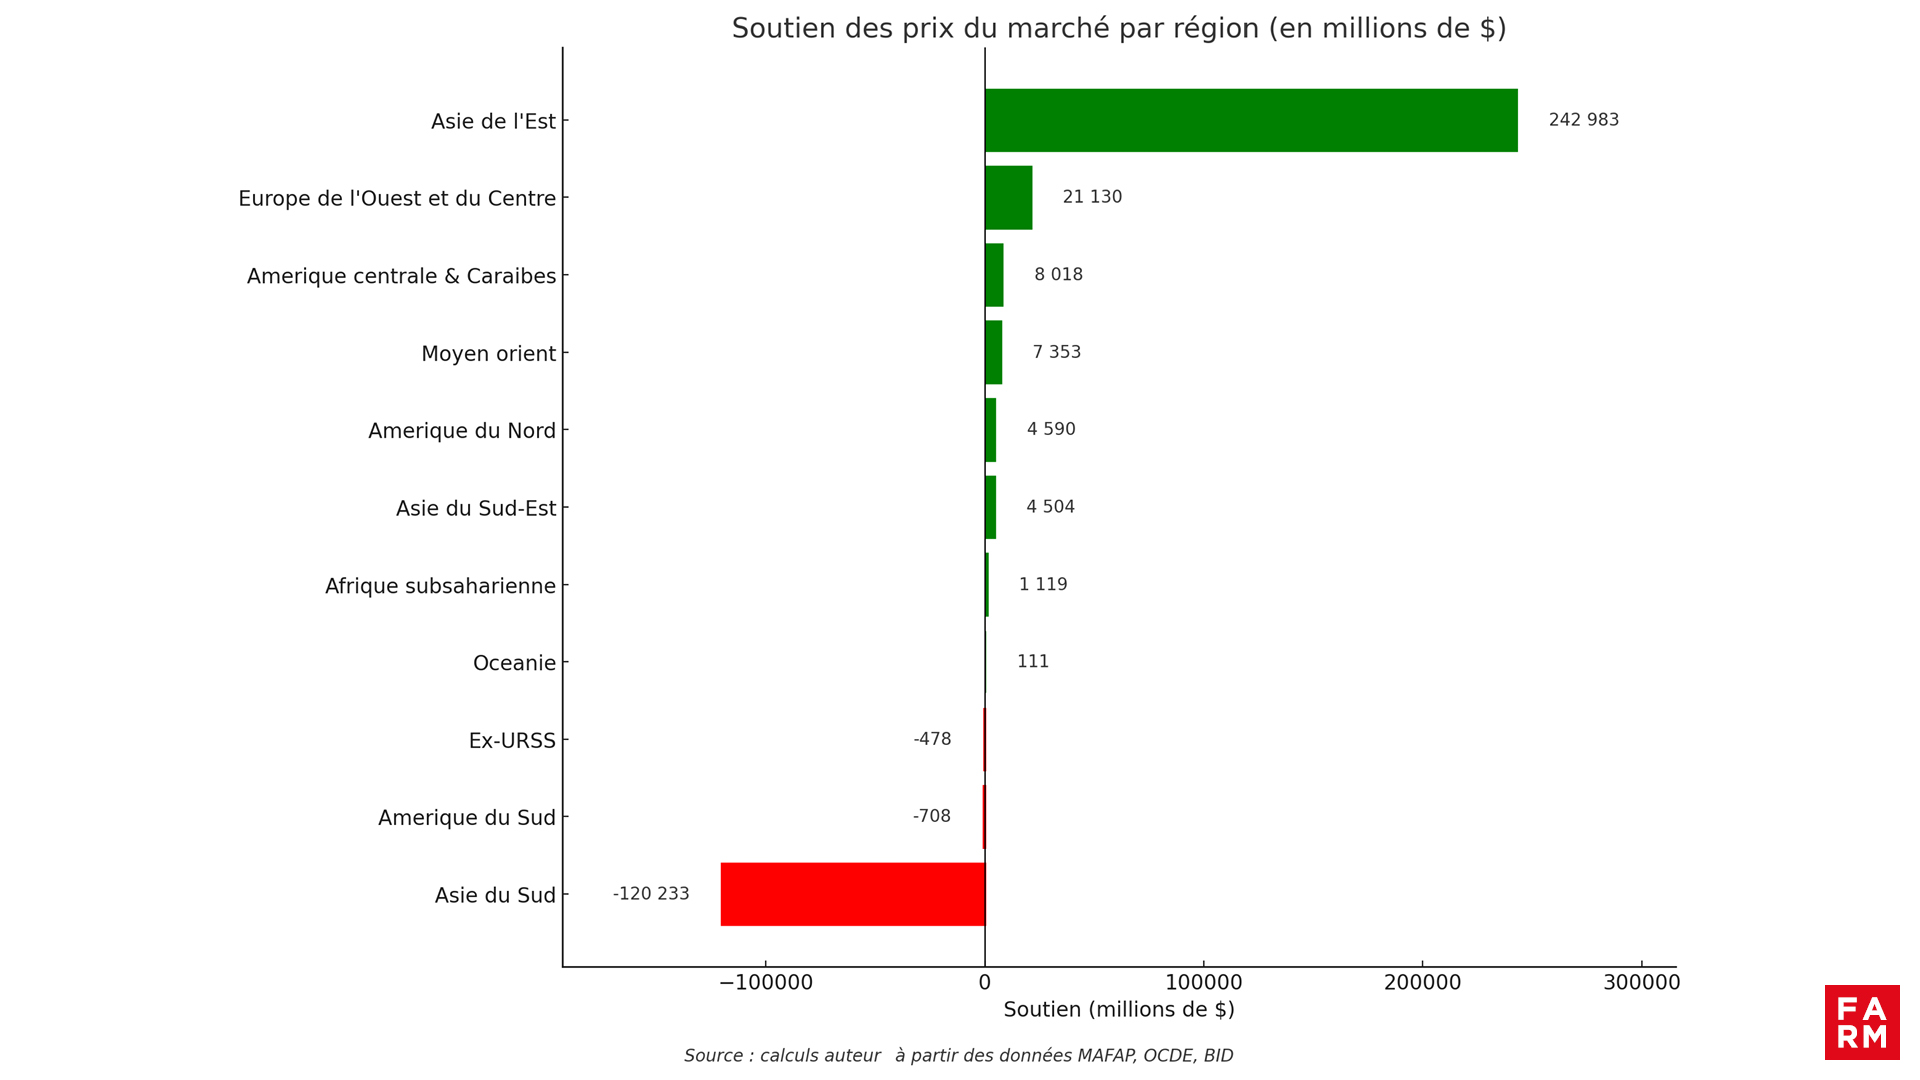
While Europe and North America have long relied on SPM as a support instrument, the global dynamic has shifted profoundly. Today, East Asia China now accounts for the bulk of positive price support, with nearly USD 243 billion—more than 80% of the global total. China is the main driver, making extensive use of price support to secure its production.
Conversely, South Asia displays a massive negative PMS -120.2 billion USD. South America also records a negative balance (-708 million USD). In these regions, agriculture is not subsidized by prices, it is implicitly "taxed" to support consumer purchasing power or public finances.
Chart 1 – Market price support by region (average of the last three available years, in millions of USD).
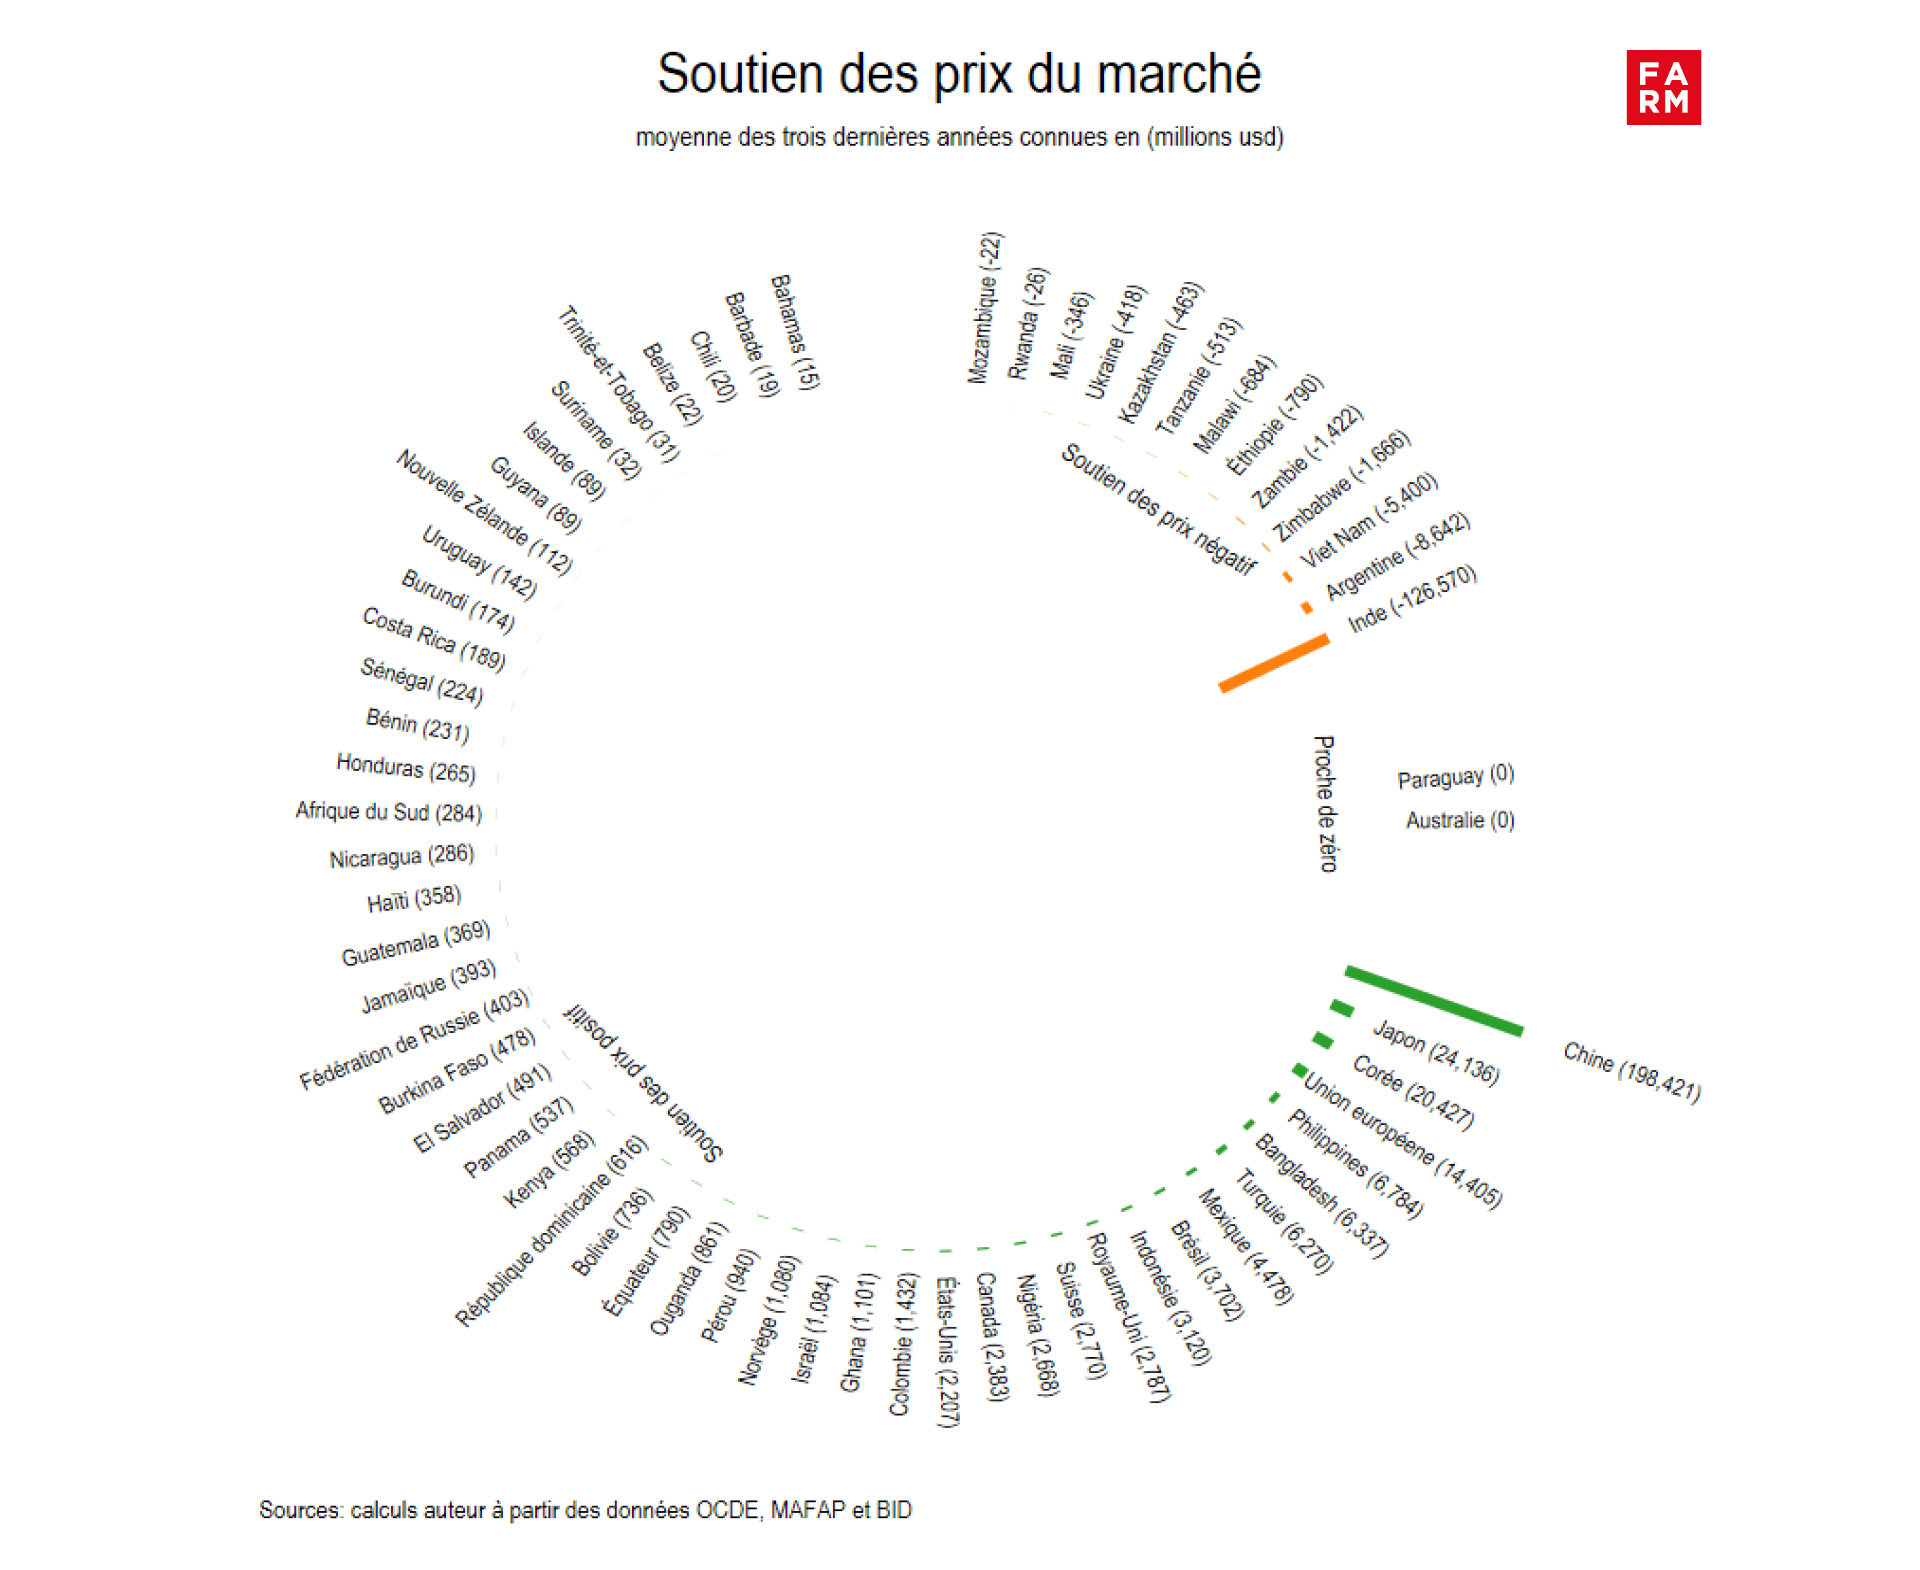
Beyond the regional observation, the country-level analysis highlights the strong heterogeneity of agricultural price support policies at the global level. (Graph 2). It reveals not only the scale of transfers in certain countries, but also the diversity of policy choices associated with this type of support for the sector. agricultural.
There China, with an estimated SPM of nearly 200 billion USD, overwhelmingly dominates the ranking, reflecting the massive use of domestic price support instruments, particularly on several strategic products such as the corn (USD 42.3 billion), pork (32.6 billion) or the rice (24.8 billion).She is followed by the Japan (USD 24.13 billion) and the South Korea (USD 20.43 billion) which maintain historically protectionist policies on basic commodities such as rice (USD 7.7 billion) and milk (USD 3.15 billion) for the Japan, Or rice (USD 4.13 billion) and pork (USD 3.3 billion) for the South Korea.
The European Union presents an estimated SPM 14 billion USD, This reflects the continued existence of price support mechanisms in certain agricultural sectors, even though these policies have been partially reformed under the Common Agricultural Policy. The main products concerned are poultry meat (USD 5.9 billion), beef (USD 3.8 billion) and the potato (USD 1.34 billion).
The most striking case is that of India, with a strongly negative PMS (-126.6 billion USD). This figure is mainly explained by export restrictions and price control mechanisms on several basic commodities, in particular milk (- 54 billion), rice (- 12 billion) and wheat (- 12 billion). The aim is to contain food inflation and protect consumers' purchasing power. However, these measures keep agricultural prices artificially low, reducing producers' potential income.
However, this interpretation needs to be qualified. Public spending on agriculture in India are estimated at nearly 115 billion USD, which tends to mitigate, or even to neutralize, The weight of the SPM in the overall assessment of support to the sector. Depending on the year, the extent of budgetary support can thus partially or totally offset the negative effect of PMS. Overall, this configuration suggests a two-tiered support strategy: on the one hand, price policies aimed at stability and food accessibility, and on the other, budgetary transfers mobilized to preserve agricultural incomes and support production, without abandoning the objectives of price control for consumers.
Other countries also use this lever, either to stabilize domestic prices or to generate tax revenue, at the cost of a negative PMS that penalizes their producers. This is the case of Argentina (-8.6 billion USD) and the Vietnam (-5.4 billion USD), but also of Zimbabwe and of the Zambia. Unlike India, however, public spending there is too low to compensate for the potential loss of income induced by these policies, so the net effect of the support remains unfavorable to producers.
Finally, countries like Australia Or Paraguay are close to equilibrium (PMS close to zero), a sign of weak public intervention and strong commercial openness.
This country-by-country analysis shows that The rationales for intervention in agricultural prices are not limited to regional divisions or income levels alone., contrary to what was observed in the analysis of public agricultural spending. They primarily reflect political, fiscal and social trade-offs specific to each national context, between objectives of purchasing power, stabilization of agricultural income and tax revenues.
Chart 2 – Market price support by country (average of the last three available years, in millions of USD).
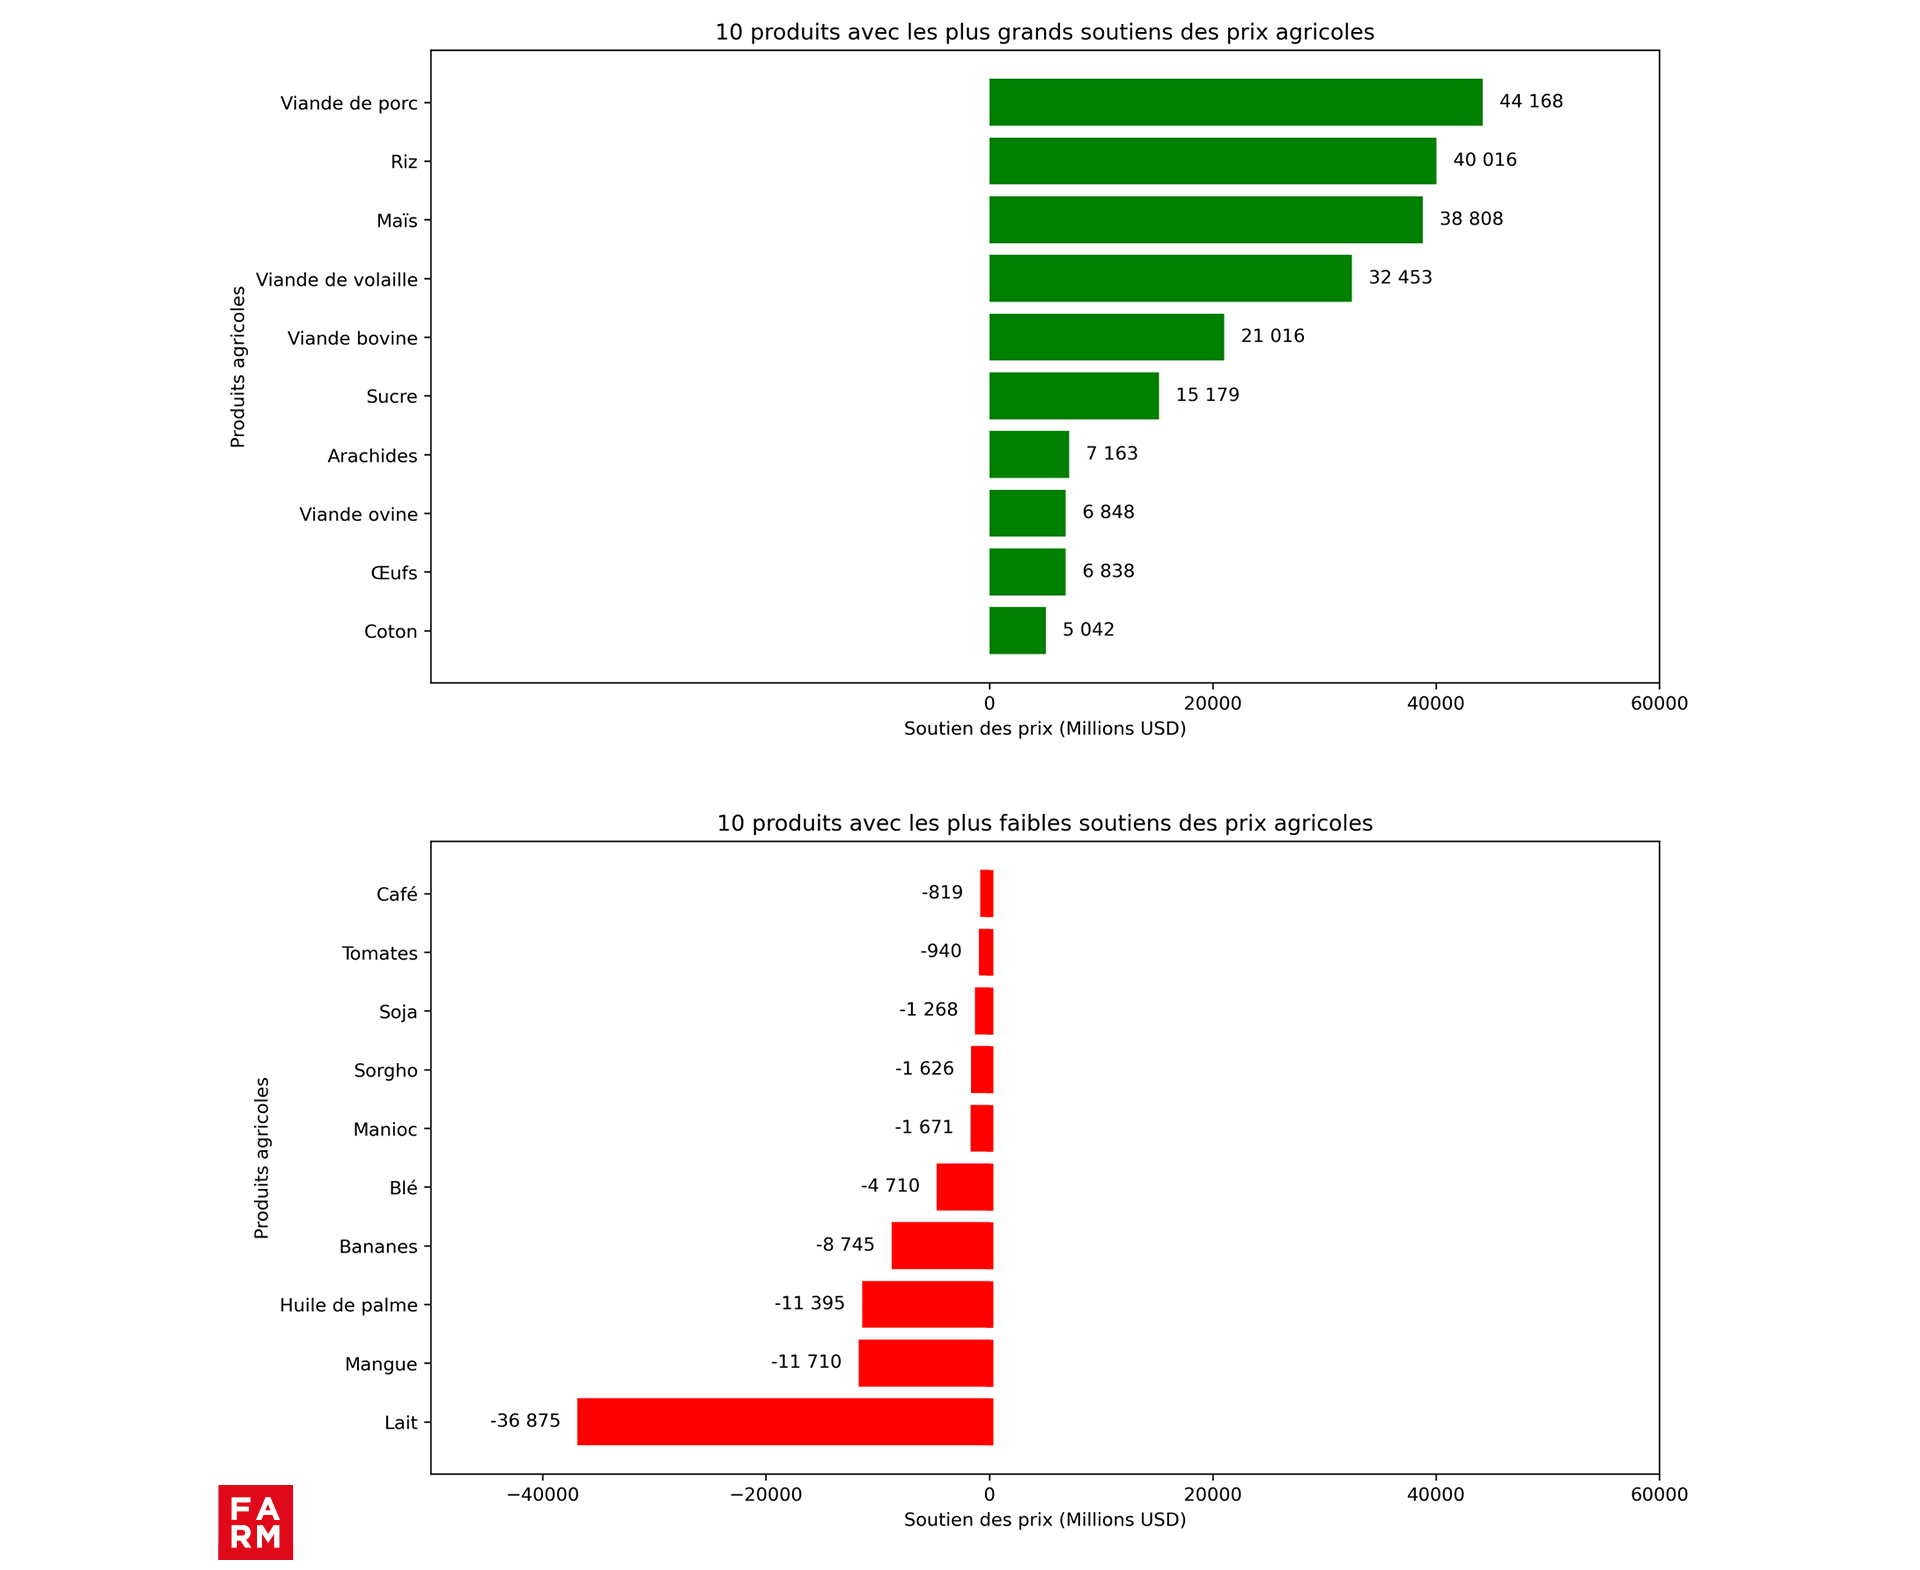
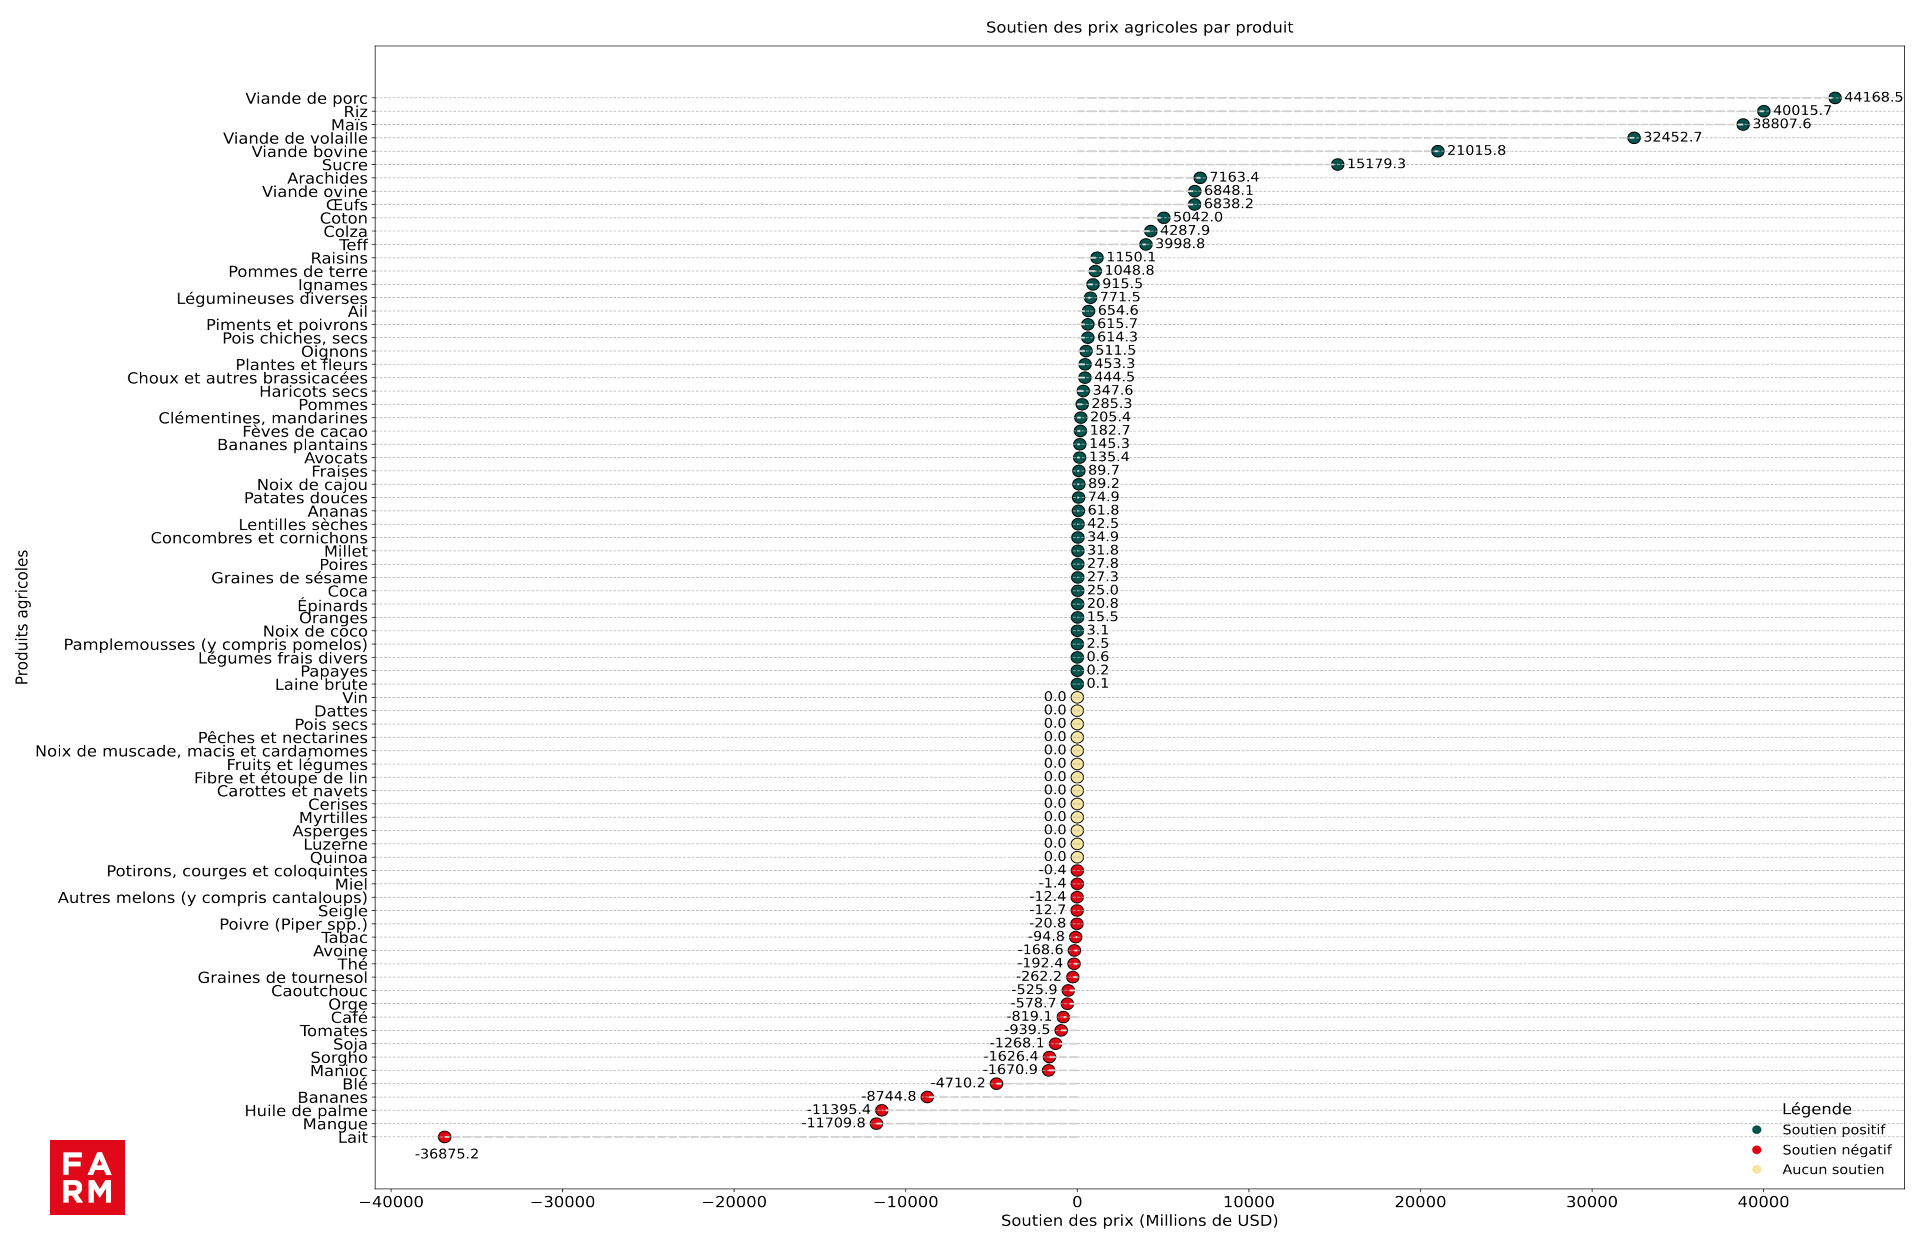
Price distortions do not affect all products in the same way. Some sectors benefit from massive support, while others are subject to implicit taxation. graph 3 presents the ten products benefiting from the highest levels of support, as well as the ten products most heavily subject to a form of implicit levy through domestic prices lower than international prices.
Positive support totals 290 billion USD and are focusing massively on the animal proteins and the strategic cereals. These pillars of food security represent nearly two-thirds of global positive PMS. pork (USD 44.2 billion), of poultry (USD 32.5 billion), of cattle and sheep (USD 27.9 billion), as well as the eggs (USD 6.9 billion) alone account for nearly 40 % of this support. The rice (USD 40 billion) and the but (USD 38.8 billion) represent approximately 27 %. This support often aims to stimulate domestic production and reduce dependence on imports, particularly in densely populated countries, especially in Asia. In addition to these main products, there is also the sugar (USD 15.2 billion), the peanuts (US$7.2 billion), the cotton (5 billion USD) and the rapeseed (USD 4.2 billion).
Conversely, the milk suffers the highest implicit taxation at the global level (-$36.9 billion)), mainly as a result of policies implemented in India (-$54 billion) to maintain the economic accessibility of dairy products for the population. Export crops such as mango (-11.7 billion USD), palm oil (-11.4 billion USD) or the banana (-8.7 billion USD) They also experience significant negative distortions. In some cases, public intervention often amounts to capturing a portion of the export-related rent, to the detriment of producers.
Chart 3 – Positive and negative market price supports by product (average over the last three available years, in billions of USD).
Sources: Author's calculations based on OECD, FAO-MAFAP, IDB and AgIncentives Consortium data
The SPM reveals a simple truth: behind every price distortion lies a major political choice. Supporting producers, protecting consumers, preserving competitiveness, or collecting revenue through export taxation — no country escapes these trade-offs, but all deal with them differently. The result is a profoundly contrasting global landscape, where some agricultural systems are boosted by prices, while others are implicitly taxed.
In a context of increased volatility, geopolitical tensions, and an urgent ecological transition, these policies can no longer remain static. The question is no longer whether if States need to rethink their support mechanisms, but how make them compatible with the imperatives of sustainability, resilience and equity.
This is precisely what the analysis of the Total Support for Agriculture and Food (TSAF) Understanding, beyond isolated figures, how budgetary transfers and market distortions combine—or contradict each other—to shape the future of food systems. Because agricultural transformation will not only take place in the fields, but also in the way public policies influence market signals.
Figure 4: A detailed analysis of SPM by product
Sources: Author's calculations based on OECD, FAO-MAFAP, IDB and AgIncentives Consortium data
Discover the analyses on the 3 main indicators of the Observatory carried out in 2022
These are all budgetary/public disbursements dedicated to the development of the agricultural sector. They include budgetary transfers to producers, transfers to consumers for access to basic products and collective services for the development of the agricultural sector (more information on the indicators is available in the methodological note).
There are very large global disparities in public support for agriculture and food. Overall, The higher the income a country has, the more it spends to support its farmers. (as a proportion of the value of agricultural production) while agriculture now provides only a minor part of employment and economic growth in the country. Thus, in high-income countries, the intensity of these expenditures is more than twice that of middle-income countries (9 %) and low income (10 %).
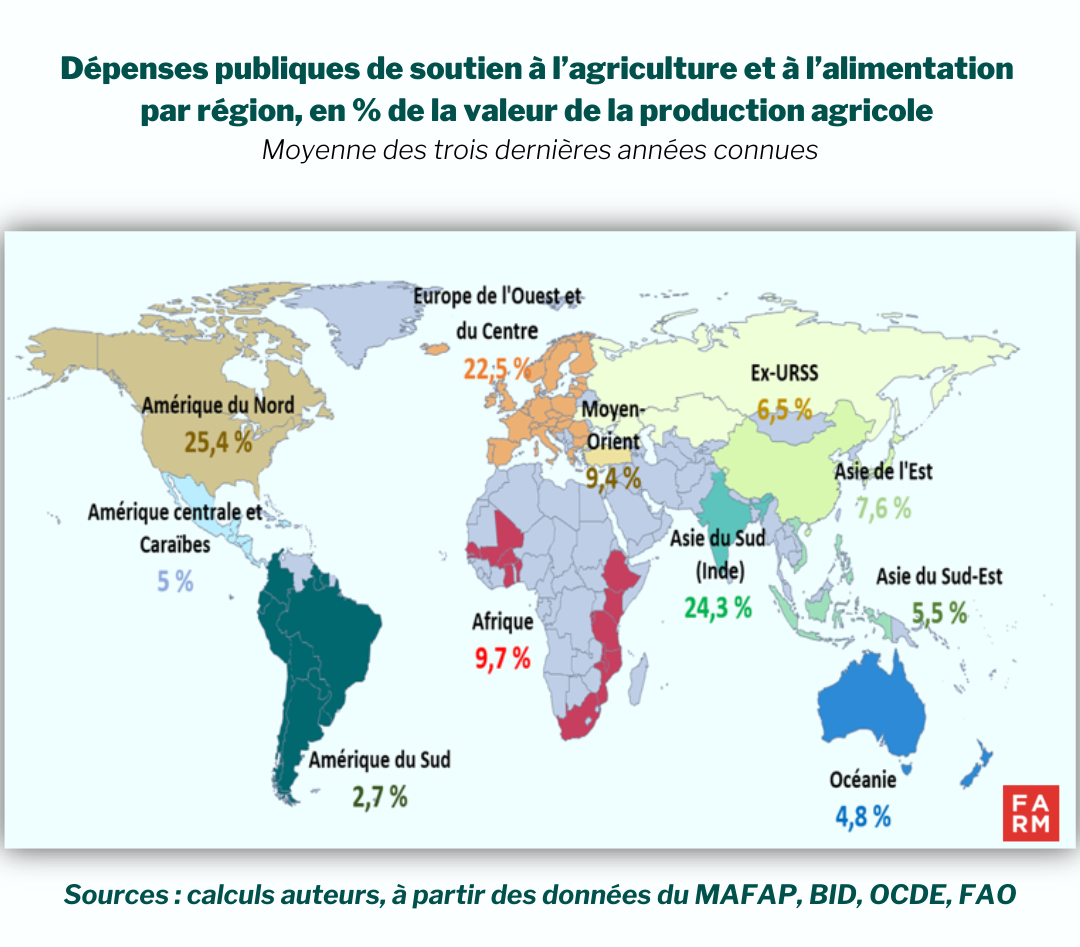
Europe and North America, which are the two leading exporting regions of raw and processed agricultural products, are also those that spend the most on their agriculture and food.As shown in Map 1, this represents between 22 and 25 % of the value of agricultural production, a particularly high figure compared to other countries and regions, with the exception of India (24 %).
It should be borne in mind that the figures above are averages, which hidesignificant variations within each country category. Thus, the intensity of public expenditure on support for agriculture and food in Oceania countries (Australia, New Zealand) is much lower than the average for high-income countries and comparable to that of certain low-income African countries.
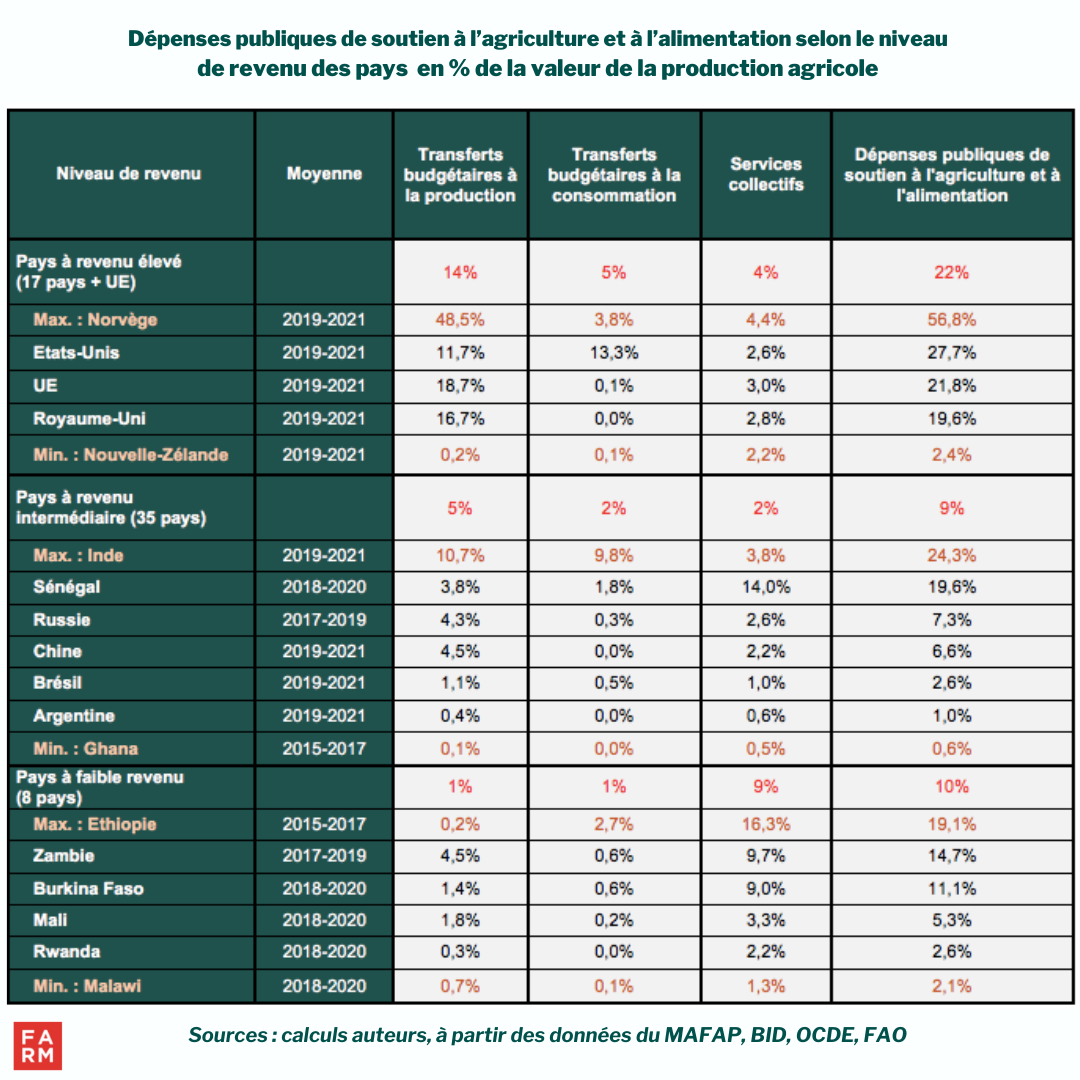
There are significant variations within each country category. These gaps are mainly due to differences in the amount of budgetary transfers to producers. These represent the bulk of support spending in high- and middle-income countries. In contrast, in low-income countries, where producers often play a key role in the economy and employment, they receive much less support. Fiscal transfers to producers are 14 times larger in high-income countries than in low-income countriesSub-Saharan Africa lags far behind, with producer support averaging less than 1% of the value of agricultural production. In Ethiopia, for example, budgetary transfers to producers are almost 100 times lower than in the EU (as a percentage of the value of agricultural production).
The FARM Observatory also analyzes budgetary transfers to consumers, which notably take the form of subsidies. High-income countries are those that support food consumption the most (5 % of the value of agricultural production). These transfers are particularly high in North America where they represent 12 % of the value of agricultural production. India is also among the countries that most support food consumption.
Despite the continuing food insecurity in sub-Saharan Africa, transfers to consumers from the state budget are less than 1 billion pounds of the value of agricultural production. These budgetary transfers to consumption in sub-Saharan Africa are mainly made up of consumer aid (98 billion pounds). Only 1 % of consumer support is devoted to processors, who are nevertheless essential to the development of agrifood sectors..

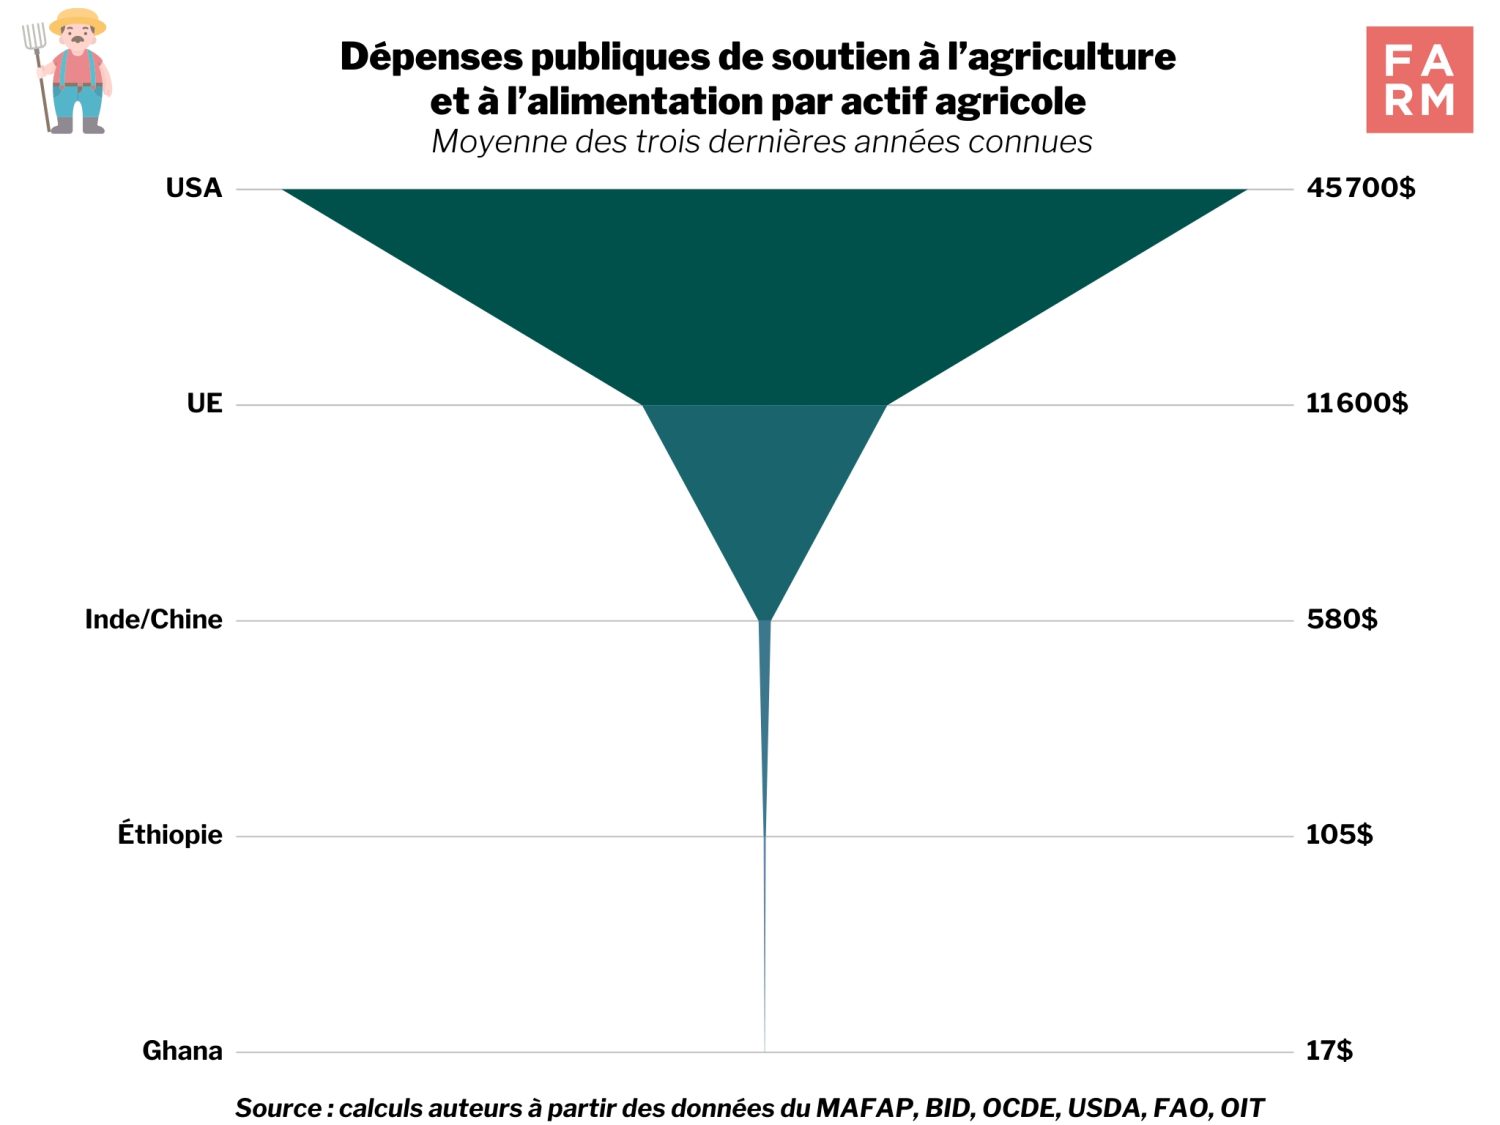
The hierarchy of the intensity of public expenditure on support for agriculture and food by country is not necessarily the same depending on the indicator used. Thus, over the period considered, support expenditure in the European Union, compared to the United States, was lower as a proportion of the value of agricultural production and agricultural value added, but significantly higher per agricultural hectare. The gap in support between rich countries, emerging countries, and low-income countries increases considerably when the amounts are related to the number of family workers or employees working in agriculture. Thus, Public spending on agriculture and food support per agricultural worker in the United States is 80 times higher than in India and 2,690 times higher than in Ghana.
Of the 15 countries analyzed in the FARM Observatory, 10 have reached the funding target decided by African states in Maputo. In 2003 in Mozambique, the latter committed themselves through the Detailed Africa Agriculture Development Programme (CAADP) to dedicate at least 10,% of public budgets to the agricultural sector in order to give it new impetus and thus stimulate its growth to 6,% per year. This threshold of 10,% has since become the performance criterion par excellence for public support for African agriculture. However, these good results are attributable to a too large a portion of rural spending that does not directly support the sector. When only expenditure specific to agricultural activity is considered, the average level of this support is reduced by more than half, from 12 % to 5 % of the total public budget. In this case, Ethiopia becomes the only country to respect its Maputo commitment.
As in all low-income countries, Most public support for agriculture and food in sub-Saharan Africa is overwhelmingly directed towards collective services for agriculture and food. These services represent more than 80 % of total agricultural budget expenditure but two-thirds do not directly target the agricultural sector. These include, for example, rural expenditure on health, education, infrastructure, etc. However, these expenditures are essential and contribute, indirectly, to the development of the agricultural sector since the majority of rural populations work in this sector. The remaining third, directly directed towards the agricultural sector, is made up of expenditure on training (2% of collective services), extension (2 %) or agricultural infrastructure (11 %).
There The share devoted to research (3 %) remains well below the target of 1 % of the agricultural gross domestic product set by the Malabo agreements (0.29 % today). However, IFPRI argued in its Global Food Policy Report (2020) that an increase in agricultural R&D in sub-Saharan Africa, amounting to 1% of agricultural GDP, could increase productivity by 60% by 2050.
Unlike in high-income countries where a large part of support takes the form of budgetary transfers to producers, in Africa these expenditures remain very low (see Table 1). They are also allocated to more than 90 % for subsidies for the purchase of inputs, to the detriment of other actions which could benefit producers just as much, if not more, such as production subsidies, income support, etc. In view of the levels of agricultural productivity in the region, this observation raises many questions regarding the effectiveness of these input subsidies (mainly fertilizers) and their weight in production aid.
While public support that goes directly to agriculture and food remains low and concentrated on certain measures, it must also be remembered that agricultural budgets depend heavily on external aid.
External aid represents on average 20 % of public expenditure to support agriculture and foodHowever, this observation hides a great disparity between countries in the degree of dependence. This dependence varies, for example, from 2 % for Ghana (2015/17) to more than 50 % for Rwanda (2016/18). On average, ¾ of this aid provided by external donors participates in financing collective services for agricultural development, with more than half devoted to rural expenditure (education, health, infrastructure, etc.).
Finally, it is necessary to underline the existence of differences in the level of budget execution from one country to anotherThe implementation of agricultural budgets faces numerous difficulties which hinder their proper execution. Indeed, only 73 % of the budgets allocated to agriculture and food are actually spent. MAFAP states several reasons for this situation, including a slower disbursement of agricultural expenditure compared to other sectors such as education, but also a non-alignment of disbursements with the needs of the agricultural activity calendar.
As calculated by the OECD, the MPS expresses the monetary value of agricultural price support. Broadly speaking, the MPS translates, for each agricultural product, the gap between the domestic market price and the world price multiplied by the volume of the product. This price gap is determined in particular by border protections, health regulations, taxes, and processing, transport, and distribution costs that affect products between the farm and the wholesale or retail market. A negative MPS means that producers receive prices lower, on average, than the world reference prices. Conversely, a positive MPS will indicate prices paid to producers higher than prices paid on international markets.
Depending on whether the MPS is positive or negative, the price received by the producer is higher or lower than the prices paid on international markets. MPS can therefore be considered as an indirect measure of import protection. The more positive it is, the more the producer is protected from competition from imported products. The more negative it is, the less so. As currently available from the FARM Observatory, MPS data are incomplete and do not yet cover sub-Saharan African countries. Therefore, this MPS analysis focuses only on high- and middle-income countries (see in the methodological note the list of countries concerned). The question of price support in African countries is, however, addressed, but through another indicator: the nominal rate of protection, calculated by the Ag Incentives consortium.
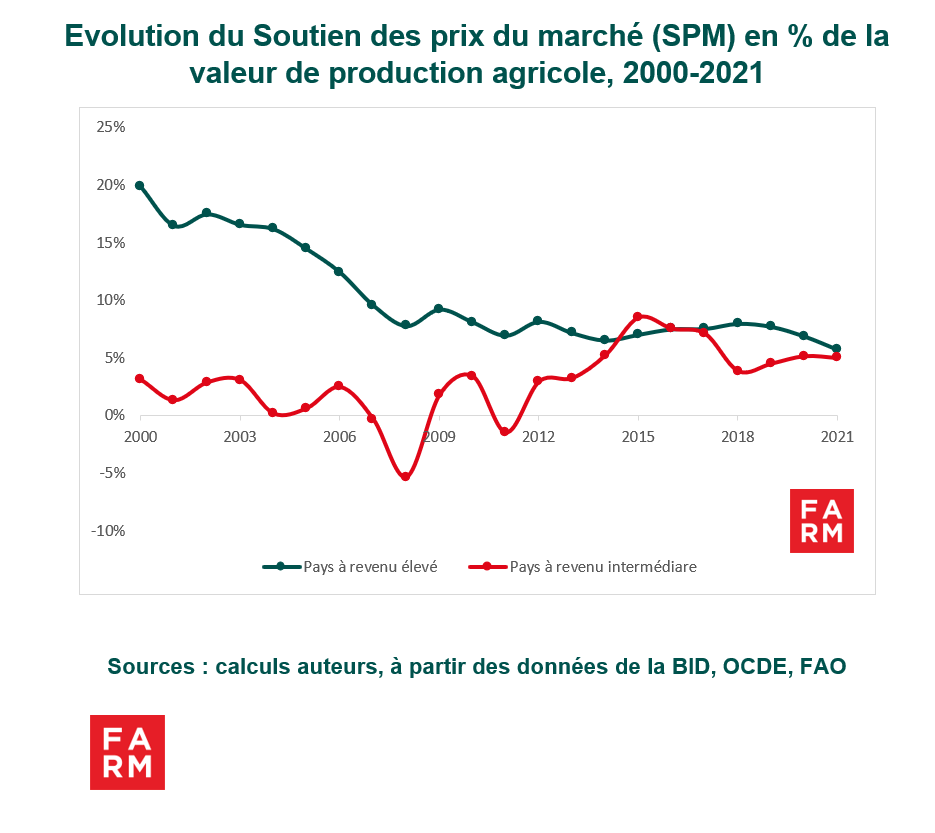
In recent decades, the level of PMS has tended to decrease significantly in high-income countries, while gradually increasing in middle-income countries. As indicated by the graph, the average gap between these two categories of countries has narrowed considerably over time and appears to have almost closed in 2021. Indeed, this gap in the MPS, expressed as a percentage of the value of agricultural production, fell on average from 15 % in 2000-2002, to only 2 % in 2019-2021. The net decline in the MPS in high-income countries could be explained, on the one hand, by agricultural policy reforms from the end of the 1980s and, on the other hand, by the constraints resulting from the Marrakech Agreement on agriculture, in 1994 at the WTO. With regard to middle-income countries, this observation could signify a desire to strengthen or improve food security and/or the foundations for a structural transformation of economies.
However, there are significant disparities in MPS, particularly among middle-income countries. It should be noted that trends by income class are averages, which conceal significant variations within each country category. Thus, the weight of certain agricultural giants, due to their support intensity and the size of their agriculture, influences the average for these categories. This is the case, for example, of China, Brazil, and India among middle-income countries.
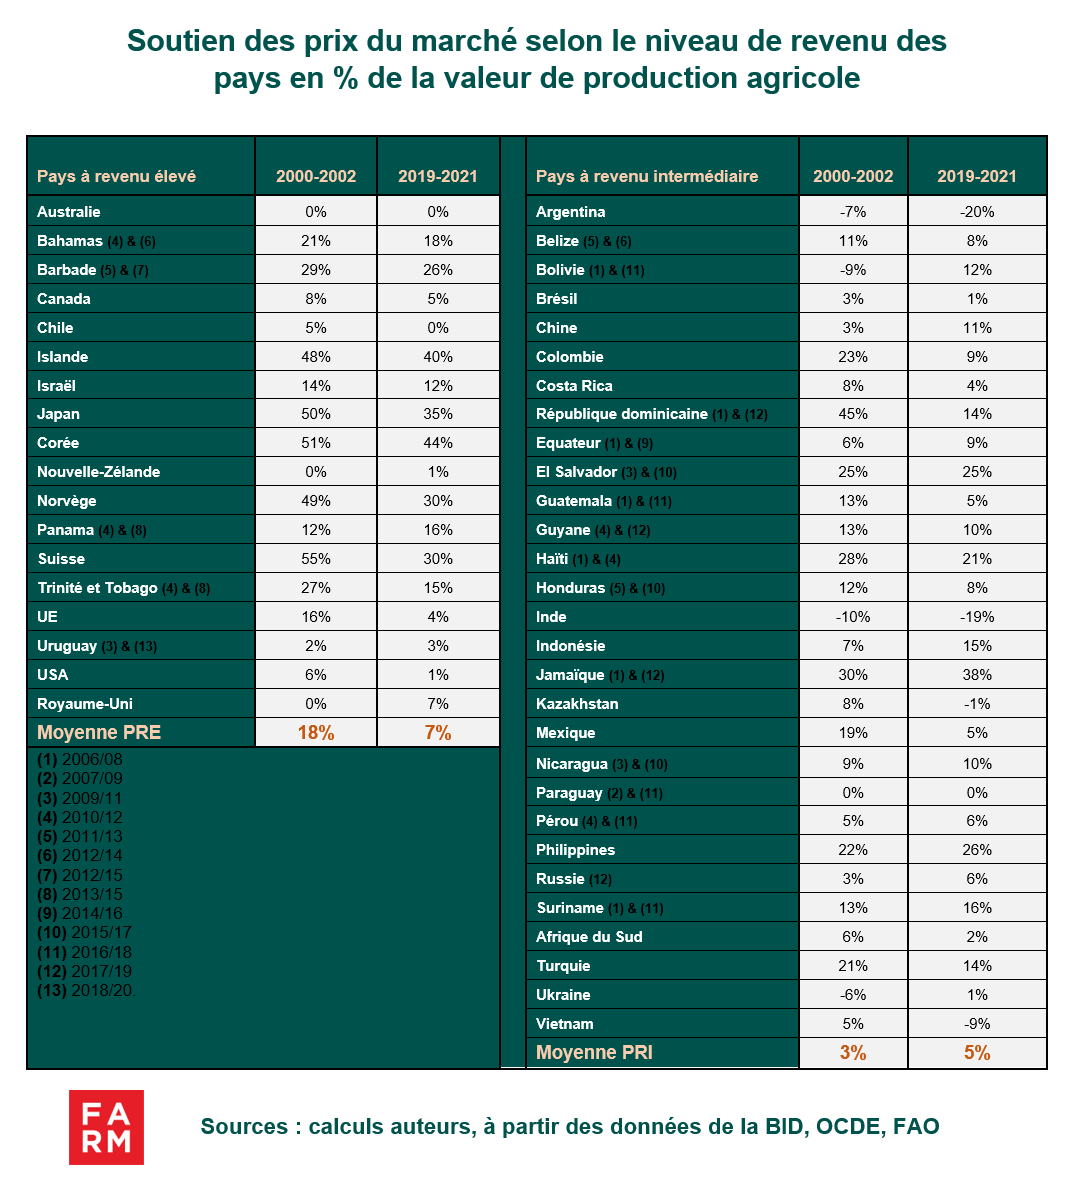
The analysis of the painting points out five middle-income countries that have negative MPS: Argentina, India, Kazakhstan, Ukraine, and Vietnam. This situation indicates that prices paid to producers in these countries are lower than world prices. This can be interpreted as an indirect levy or implicit taxation of producers. Negative MPS can be explained mainly by market inefficiencies (high processing and transport costs, monopoly rents, etc.), or regulations on the marketing of certain products (India) and export taxes (Argentina). These negative MPS give rise to transfers from producers to consumers and the State (in the form of taxes levied when the product is exported). For the period 2019-2021, negative MPS represented on average nearly 20% of the value of agricultural production in Argentina and India. Producers in these countries are heavily taxed for the benefit of consumers who benefit from low prices on basic products.
Since data are not available for African countries, we use the nominal rate of protection (NRP) to analyze agricultural price support. It expresses, for each agricultural product, the difference between the price paid to the producer and the border price, as a percentage of the border price. A negative NRP indicates that the producer is being "taxed" by the policies implemented and/or that existing protections are ineffective.
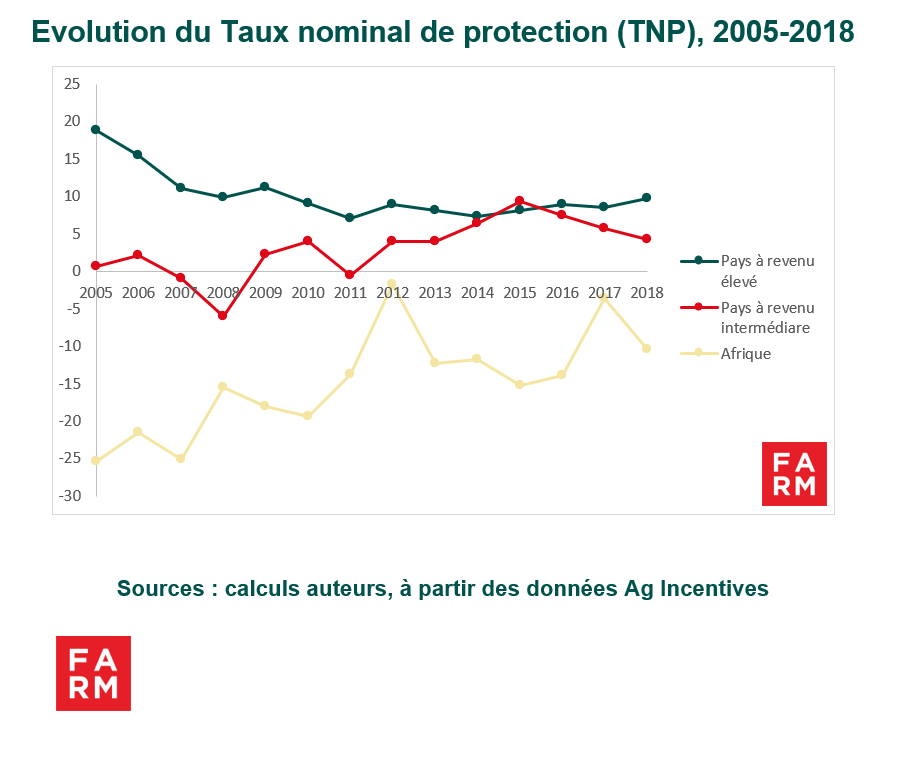
Thanks in part to strong import protection, agricultural price support is higher in high- and middle-income countries than in African countries. Moreover, it can be seen that the Nominal Rate of Protection in Africa remained negative throughout the period 2005-2018. In 2018, this Nominal Rate of Protection (NRP) in high-income countries was on average 30 percentage points higher than in Africa, compared to 5 percentage points higher than in middle-income countries. This change in the NRP shows that African agriculture is relatively unprotected and to a lesser extent than in other developing regions. (see FARM's study on import protections)This observation is all the more important since Public expenditure on agriculture and food (DPAA) is also much lower in African countries.
This negative NPT means that African governments are primarily protecting consumers to the detriment of agricultural producers. Indeed, sub-Saharan African states have long maintained, against the agricultural sector, an "urban bias" which resulted in relatively low customs duties - priority being given to supplying cities with imported products -, taxation of exported agricultural products, etc.. This situation results in African producers facing competition from low-cost imported products from countries or regions where agricultural productivity is considerably higher. This is all the more so since a number of these countries – particularly the Member States of the European Union, the United States, but also India and China – heavily subsidize their agriculture, often for a long time, which has also allowed them to build comparative advantages in this sector. However, there is a strong correlation, in different regions of the world, between the elimination of the urban, anti-agricultural bias and the level of development of several emerging countries, particularly in Asia.
Asking this question means reopening the thorny debate on the protection of African agriculture. This debate is particularly important in the context of the redefinition of the Africa-Europe partnership and the renegotiation of the Economic Partnership Agreements (EPAs). Moreover, the African continent has been committed since 2018 to the creation of an African Continental Free Trade Area (AfCFTA), established in January 2021. The creation of the AfCFTA calls into question the future of trade relations between African countries as well as the level of protection of agriculture and agri-food sectors. This issue should constitute a key pillar of the African Union's political agenda at a time when the objective of food sovereignty is reaffirmed.
Currently, agricultural support in Africa is caught in a political contradiction. Spending on agricultural and food support is supposed to boost the sector's productivity. However, negative support for agricultural prices erases the effects of this spending and does not provide farmers with a climate conducive to improving production. This observation raises a broader the question of the coherence of agricultural and trade policies.
A little background: the FARM Observatory uses three key indicators to assess governments' commitment to agriculture and food. These indicators are public spending on agriculture and food, market price support, and total support.
Two major trends have been noted:
1) Countries that depend most on agriculture spend the least to support their farmers;
2) Rich and emerging countries have more pronounced protectionist policies to support domestic prices in the face of competition from imported agricultural products, particularly compared to African countries which are relatively less competitive.
Let us now focus on the total support that reveals a global landscape dominated by rich countries and a rise in emerging economies. Total support to agriculture and food is equal to the sum of public spending and the agricultural price supportOver the period 2019/21, it was on average twice as high in high-income countries as in middle-income countries.
High-income countries support their agriculture and food sector on average with 29 billion pounds of the value of agricultural production, compared to 14 billion pounds for middle-income countries. However, we do not have data on agricultural price supports in low-income countries to compare them with others.
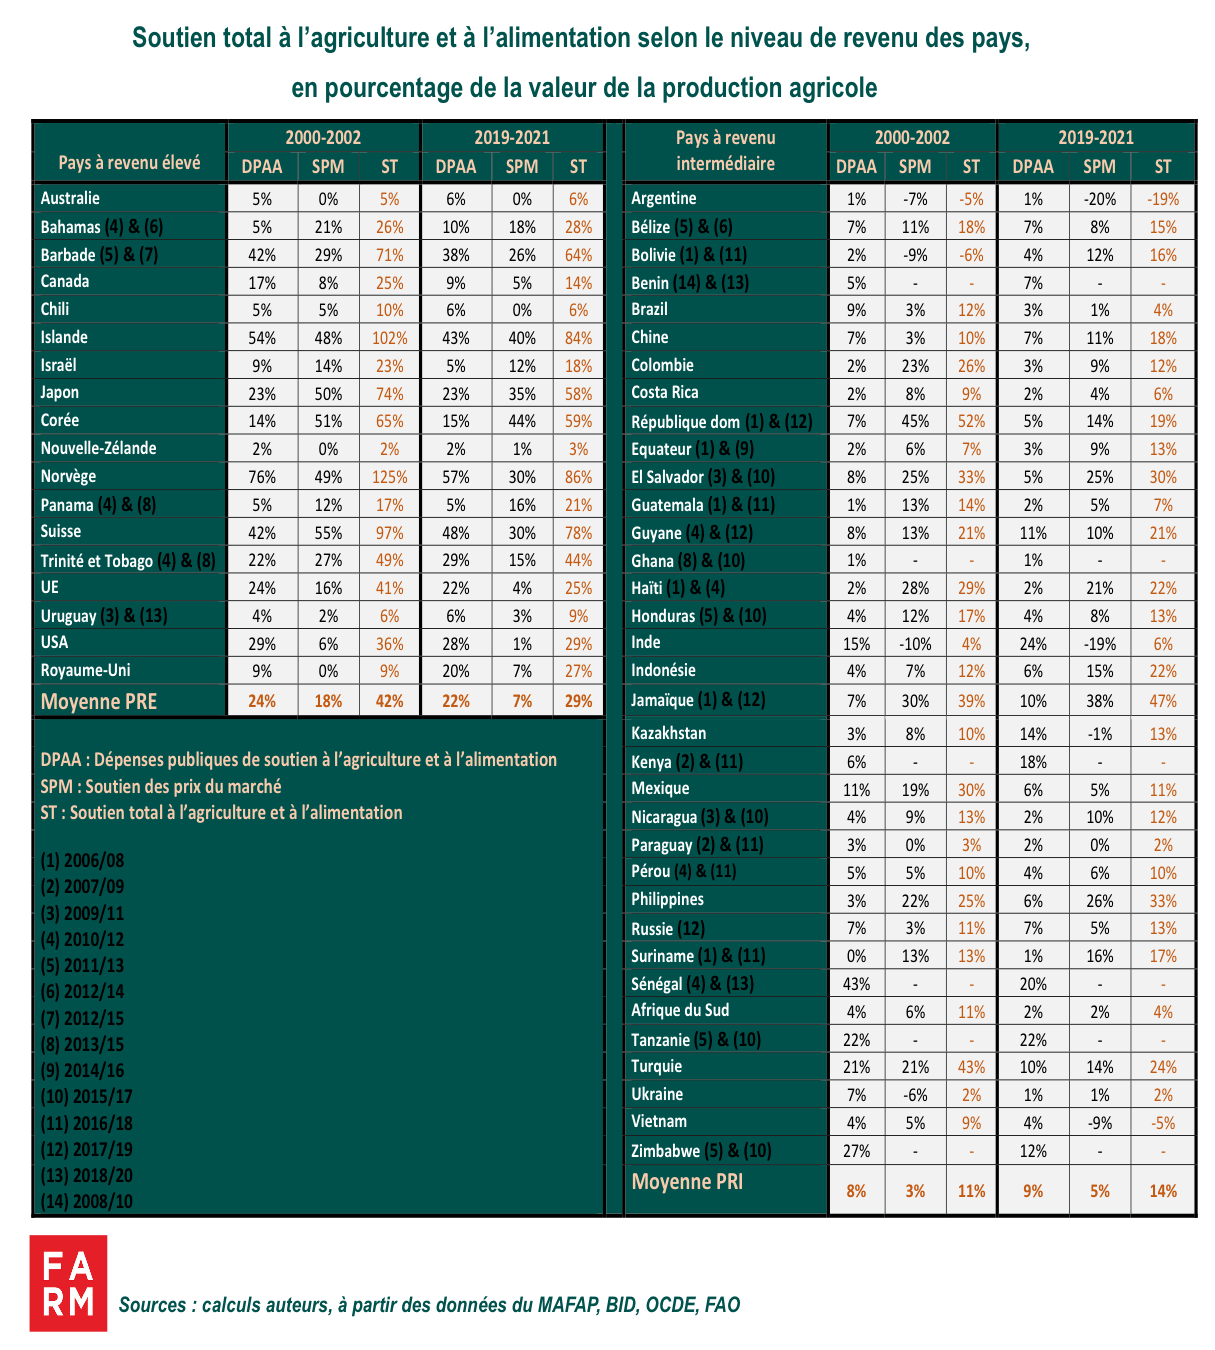
However, total support to agriculture and food in high-income countries has declined significantly over the past 20 years. It has been reduced by almost half, from 44 billion of the value of agricultural production in 2000 to 25 billion in 2021. This decline in total support is observed up to 2014 and remains attributable to to agricultural policy reforms undertaken by these countries to comply with the rules of the Agreement on Agriculture. These were signed at the end of the Uruguay Round of trade negotiations which led to the creation of the World Trade Organization (WTO) in 1994. Conversely, emerging countries have increased their support for agriculture to promote the development of their agricultural sector and ensure their food security.
These developments must, however, be viewed with caution, as total support automatically decreases when world agricultural prices increase, even if agricultural policies remain unchanged. This caution is justified by the method of calculating market price support. This is because it is calculated for a given agricultural product by multiplying the quantity produced by a price gap. This price gap is itself obtained from a difference between the domestic market price and the world price of the product concerned. Therefore, any increase in the world price of the product has the mechanical effect of reducing the difference between the latter (world price) and the domestic market price and, consequently, a reduction in market price support and total support.
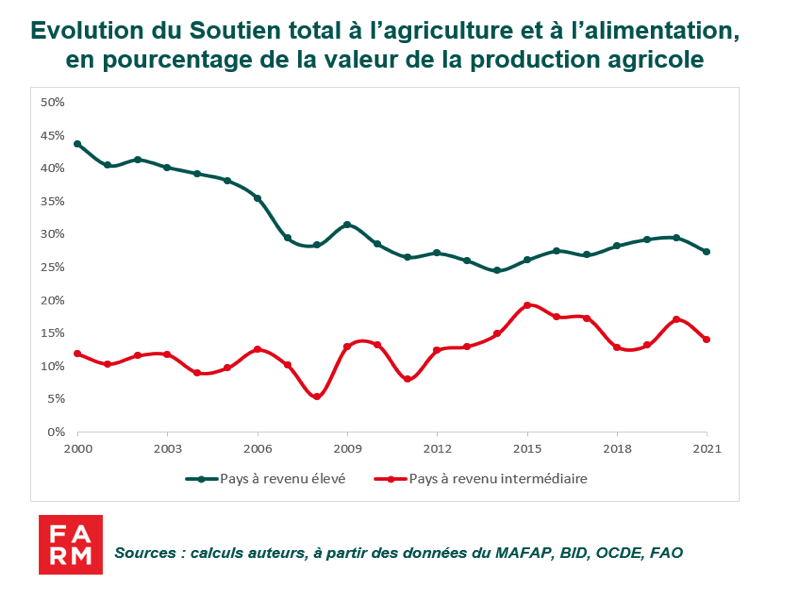
As the graph showing the evolution of total support shows, in recent years there has been a widening of the gap in total support to agriculture and food between high- and middle-income countries after a long period of trend convergence. Since 2015, this gap has been linked to different agricultural support strategies. Public expenditures in support of agriculture and food (budgetary transfers to producers or consumers, investments in research, infrastructure, training, etc.) have thus increased in high-income countries since 2014. In middle-income countries, apart from a slight increase of 1 % in 2020, notably to support the agricultural sector in the face of the Covid-19 pandemic, the level of these budgetary disbursements has remained relatively constant over the last two decades. The increase in total support to agriculture and food in these countries is attributable to market price support policies such as border measures (customs duties, export subsidies and taxes, or import and export quotas) and non-tariff measures (health regulations).
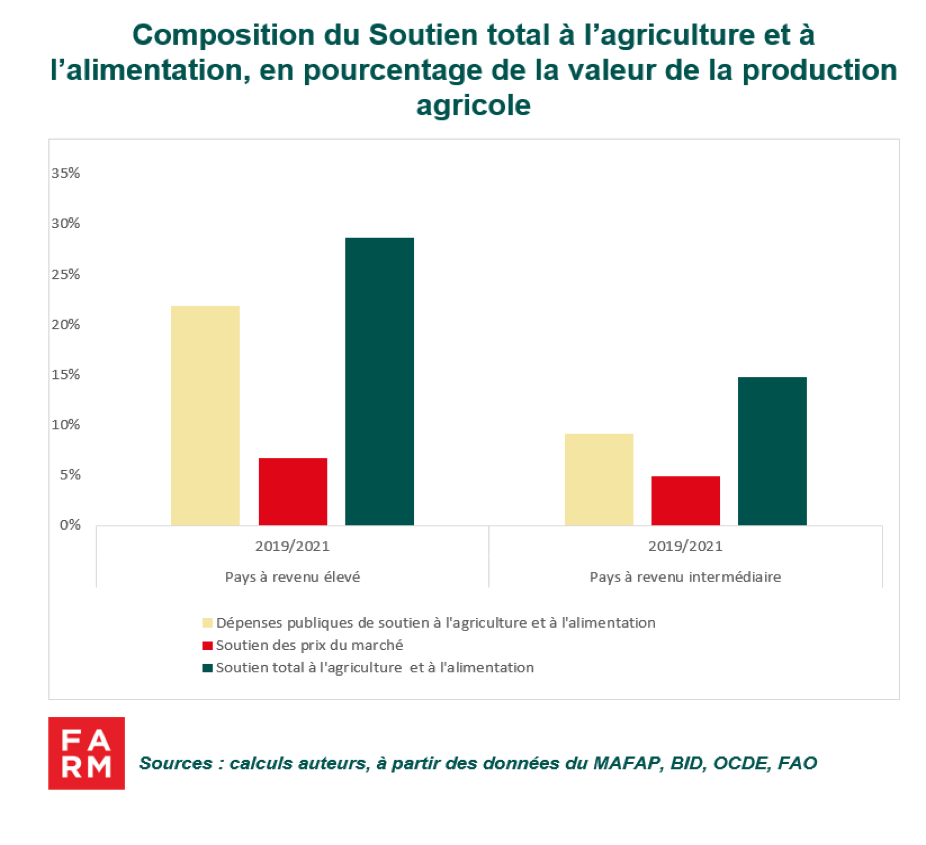
Although they are at different levels in rich countries and in emerging countries, most of the total support is provided in the form of budgetary expendituresThese public expenditures reach more than 75 % of the total support of high-income countries and represent no less than 60 % in emerging countries.
Typically, negative support policies often aim to achieve food security objectives by offering low prices to consumers, or to mobilize budgetary resources by collecting tax revenues through export taxes on certain agricultural products. Although there are significant differences between countries, it should be noted that this type of support characterizes some middle-income countries. This occurs when the monetary value of agricultural price support is lower than public expenditures on agriculture. Argentina and Vietnam are examples, with negative price support policies., respectively -20 % and -9 % of the value of agricultural production while public expenditure is only 1 % and 4 %. Thus, their total support to agriculture and food is reduced to -19 % and -5% of the value of agricultural production. In other words, for Argentina, this means that the State gives on one hand 1 % of the value of agricultural production in support of its farmers, to take back 20 % with the other via export taxes for example.
India also provides similar support to its farmers, but to a lesser extent: it does not take out more than it gives. With government spending and market price support of 24 and -19 billion pounds respectively, total support to agriculture and food is 5 billion pounds of the value of agricultural production. It should be noted, however, that Argentina, India and Vietnam have competitive agriculture. and are major exporters of agricultural products in the world, which allows them to practice such policies without compromising the prosperity of their agricultural sectors.
In the absence of comparable data to assess total support to agriculture and food in sub-Saharan Africa, previous analyses on the nominal rate of protection and public support spending provide an idea of overall support for agriculture. They show that the low competitiveness of agricultural sectors in these countries, combined with weak protection against imports of low-cost and heavily subsidized products, reduces the effectiveness of public spending on agriculture, which is also insufficient. However, agriculture in Africa is seriously lacking in investment and protection to address the many challenges it faces. It therefore appears essential that support for agriculture be intensified in Africa, by governments with public policies that address the sector from the broader perspective of value chains, beyond agricultural production. Indeed, a systemic approach to agriculture, from field to fork, with social protection measures including nutrition strategies, but also biodiversity conservation policies, appears essential. All the more so since the effects of climate change will weigh heavily on the continent's capacity to produce and feed a rapidly growing population. The role of technical and financial partners is crucial in this context to support these transformations.
The second Dakar summit on food sovereignty and resilience seems to indicate a desire to give agriculture renewed importance in African policies, but it is still necessary to move from intentions to actions to realize the continent's agricultural and food potential..