Market price support (MPS): supporting farmers without penalizing consumers, an impossible balance?
Market Price Support (MPS), The non-budgetary channel of public agricultural support reveals major trade-offs. Between supporting producers and protecting consumers, it paints a picture of a profoundly unequal agricultural world, where prices favor some and tax others.

After deciphering budgetary expenditures in our previous section, the Global Observatory of Public Support for Agriculture and Food focuses on the second pillar of agricultural support: Market Price Support (MPS). If budgetary expenditures are the tip of the iceberg, the SPM (Strategic Performance Management) constitutes the submerged part. Less visible in state budgets, it is nonetheless crucial for the farmers' income, food safety and the competitiveness of sectors around the world.
Understanding market price supports (MPS)
Before delving into international comparisons, it is essential to understand what Market Price Support (MPS) actually measures. This often technical concept nevertheless sheds light on an entire area of agricultural policy that falls outside the scope of public budgets. This section lays the groundwork: how MPS works, what it reveals, and why it is indispensable for analyzing price distortions.
Unlike government spending (DPAA), which is actual disbursements from the government, SPM is an economic estimate of what the market transfers as a result of government policies. It measures the difference between the domestic price received by a farmer for his production and a reference price linked to international trade, adjusted to be comparable to the price observed on the domestic market. This discrepancy is not the result of chance, but the direct consequence of public policies: customs duties, import quotas, guaranteed prices or, conversely, export taxes and price control.
While public spending measures the budgetary effort of states, Market Price Support (MPS) measures the impact of trade and regulatory policies on the prices paid to producers. It thus reflects the extent of distortions induced by public policies on domestic agricultural markets.
The analysis of the SPM is essential because it highlights two major trends in agricultural policies. On the one hand, some countries support their producers by maintaining high domestic prices. On the other hand, price policies result in an implicit taxation of agriculture, either to contain food prices or to capture public revenue from exports.
This diversity is reflected in the value of the SPM, which can be positive, negative, or close to zero. Each of these configurations has distinct implications for farm incomes, access to food, and international competitiveness:
-
- A positive PMS This means that the domestic price paid to the producer is higher than the reference price linked to international trade. As a result, implemented public policies generate an implicit transfer of profits to support producers, as seen in China with pork, for example. This support can stimulate domestic production and boost agricultural incomes, but it also increases costs for consumers. When the PMS is high, it can also fuel criticism of protectionism and be a source of trade tensions. It can also affect the competitiveness of domestic products in international markets.
- A negative PMS indicates that the prices paid to farmers for their production are lower than international reference prices. It is similar to a Implicit taxation agricultural production, which is likely to reduce profitability, of discourage investment and, depending on the context, of reduce domestic supply. This situation is common when governments seek to maintain low food prices for the benefit of urban consumers, as is often the case in many sub-Saharan African countries. It sometimes reflects a urban bias, where social stability in cities and the purchasing power of urban households take precedence over producer compensation, at the cost of an implicit transfer of production from rural to urban areas and a weakening of incentives to produce locally. When the product in question is primarily exported, such as soybeans from Argentina, this negative SPM (Single Productive Price) resembles an implicit export tax, potentially generating public revenue.
- A PMS of zero or close to zero This translates into an alignment of domestic prices with reference prices. Producers and consumers then operate in a relatively distortion-free environment, where price signals from international markets are transmitted more directly.
USD 168 billion in net transfers: a misleading global average
Globally, net transfers related to SPM reach approximately 168 billion USD, according to estimates produced by the FARM Observatory, which mobilizes and aggregates — over the last three years available — data from the OECD, the IDB/IDB and the MAFAP.
However, this global average is misleading, as it results from diametrically opposed national policies, the effects of which can cancel each other out in the aggregate. To understand the reality of the dynamics at play, it is necessary to examine more closely the nature and extent of the distortions. (Graph 1).
The geography of distortions: who provides support and who taxes?
Price policies are not evenly distributed around the world. Some regions provide massive support to their producers, while others implicitly tax their agriculture. This section reveals the major geographical areas and dynamics that are currently reshaping the global map of agricultural price support.
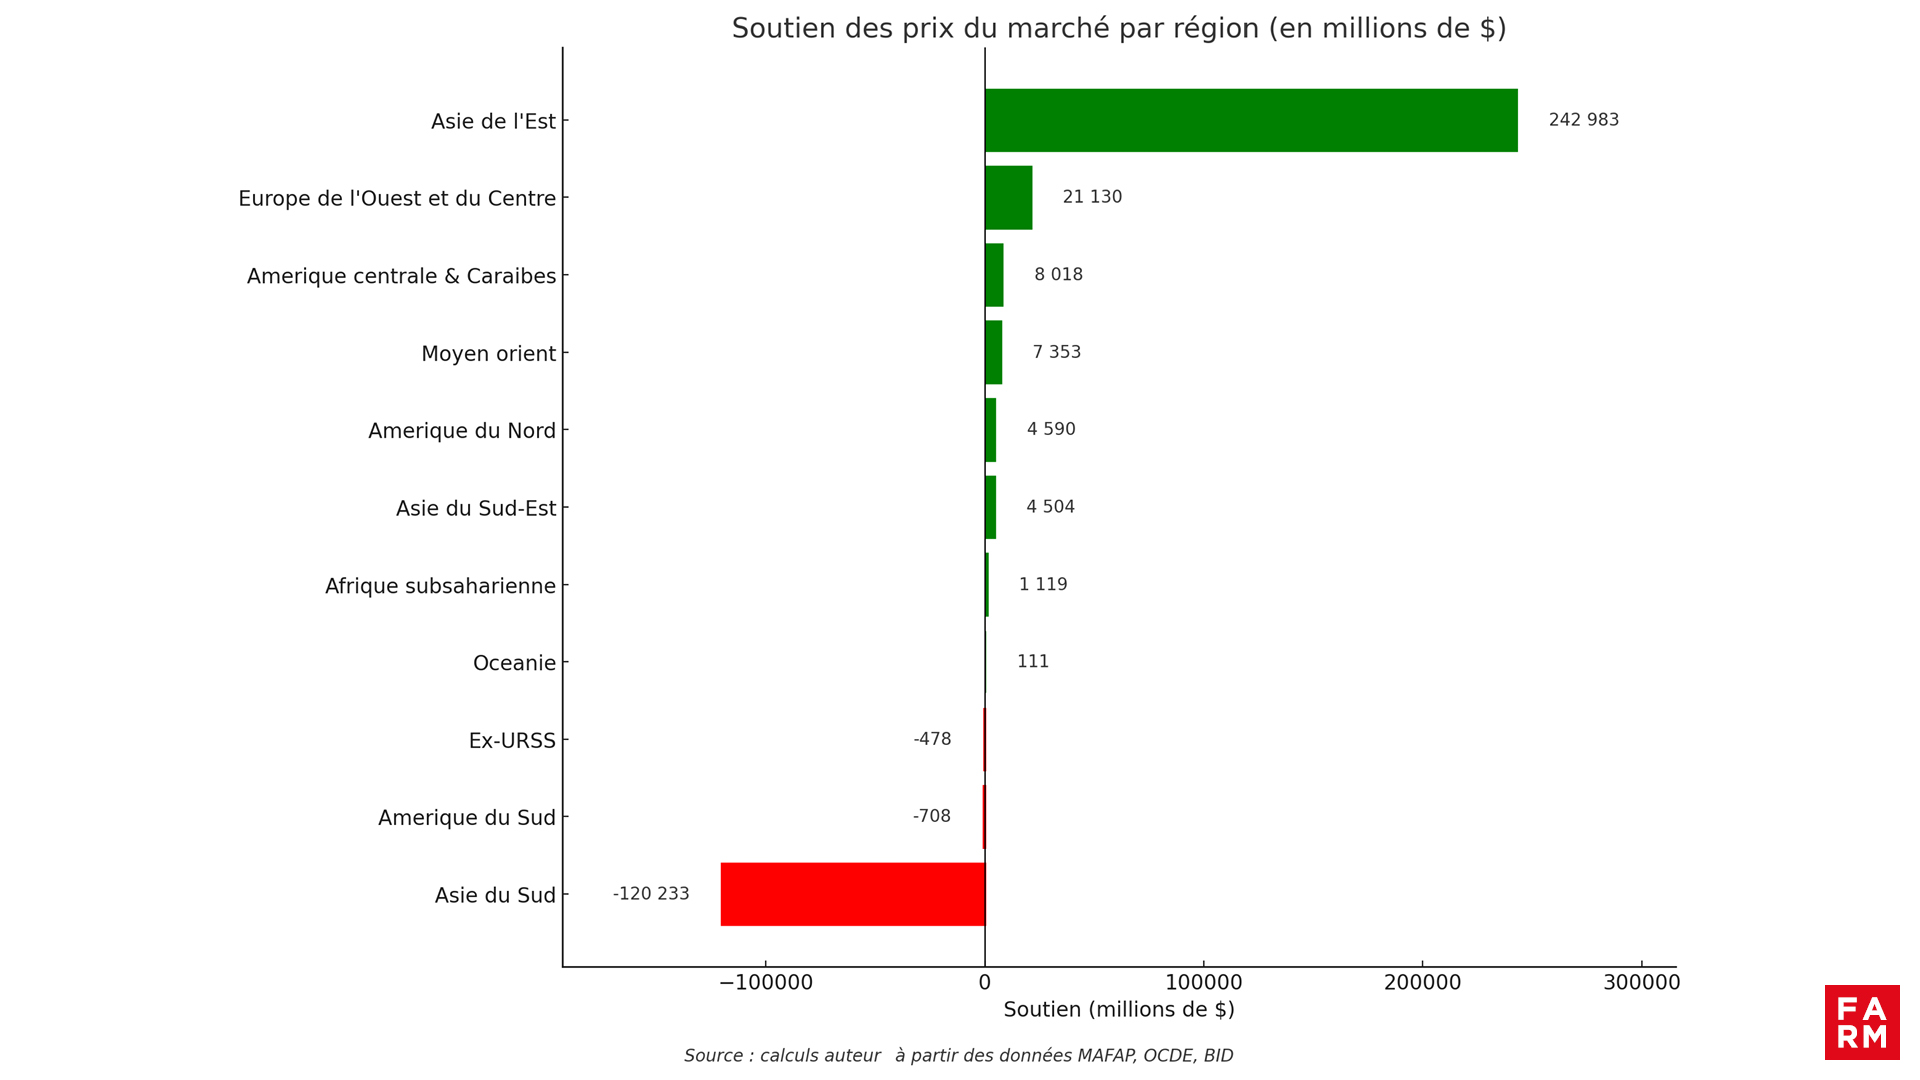
While Europe and North America have long relied on SPM as a support instrument, the global dynamic has shifted profoundly. Today, East Asia China now accounts for the bulk of positive price support, with nearly USD 243 billion—more than 80% of the global total. China is the main driver, making extensive use of price support to secure its production.
Conversely, South Asia displays a massive negative PMS -120.2 billion USD. South America also records a negative balance (-708 million USD). In these regions, agriculture is not subsidized by prices, it is implicitly "taxed" to support consumer purchasing power or public finances.
Chart 1 – Market price support by region (average of the last three available years, in millions of USD).
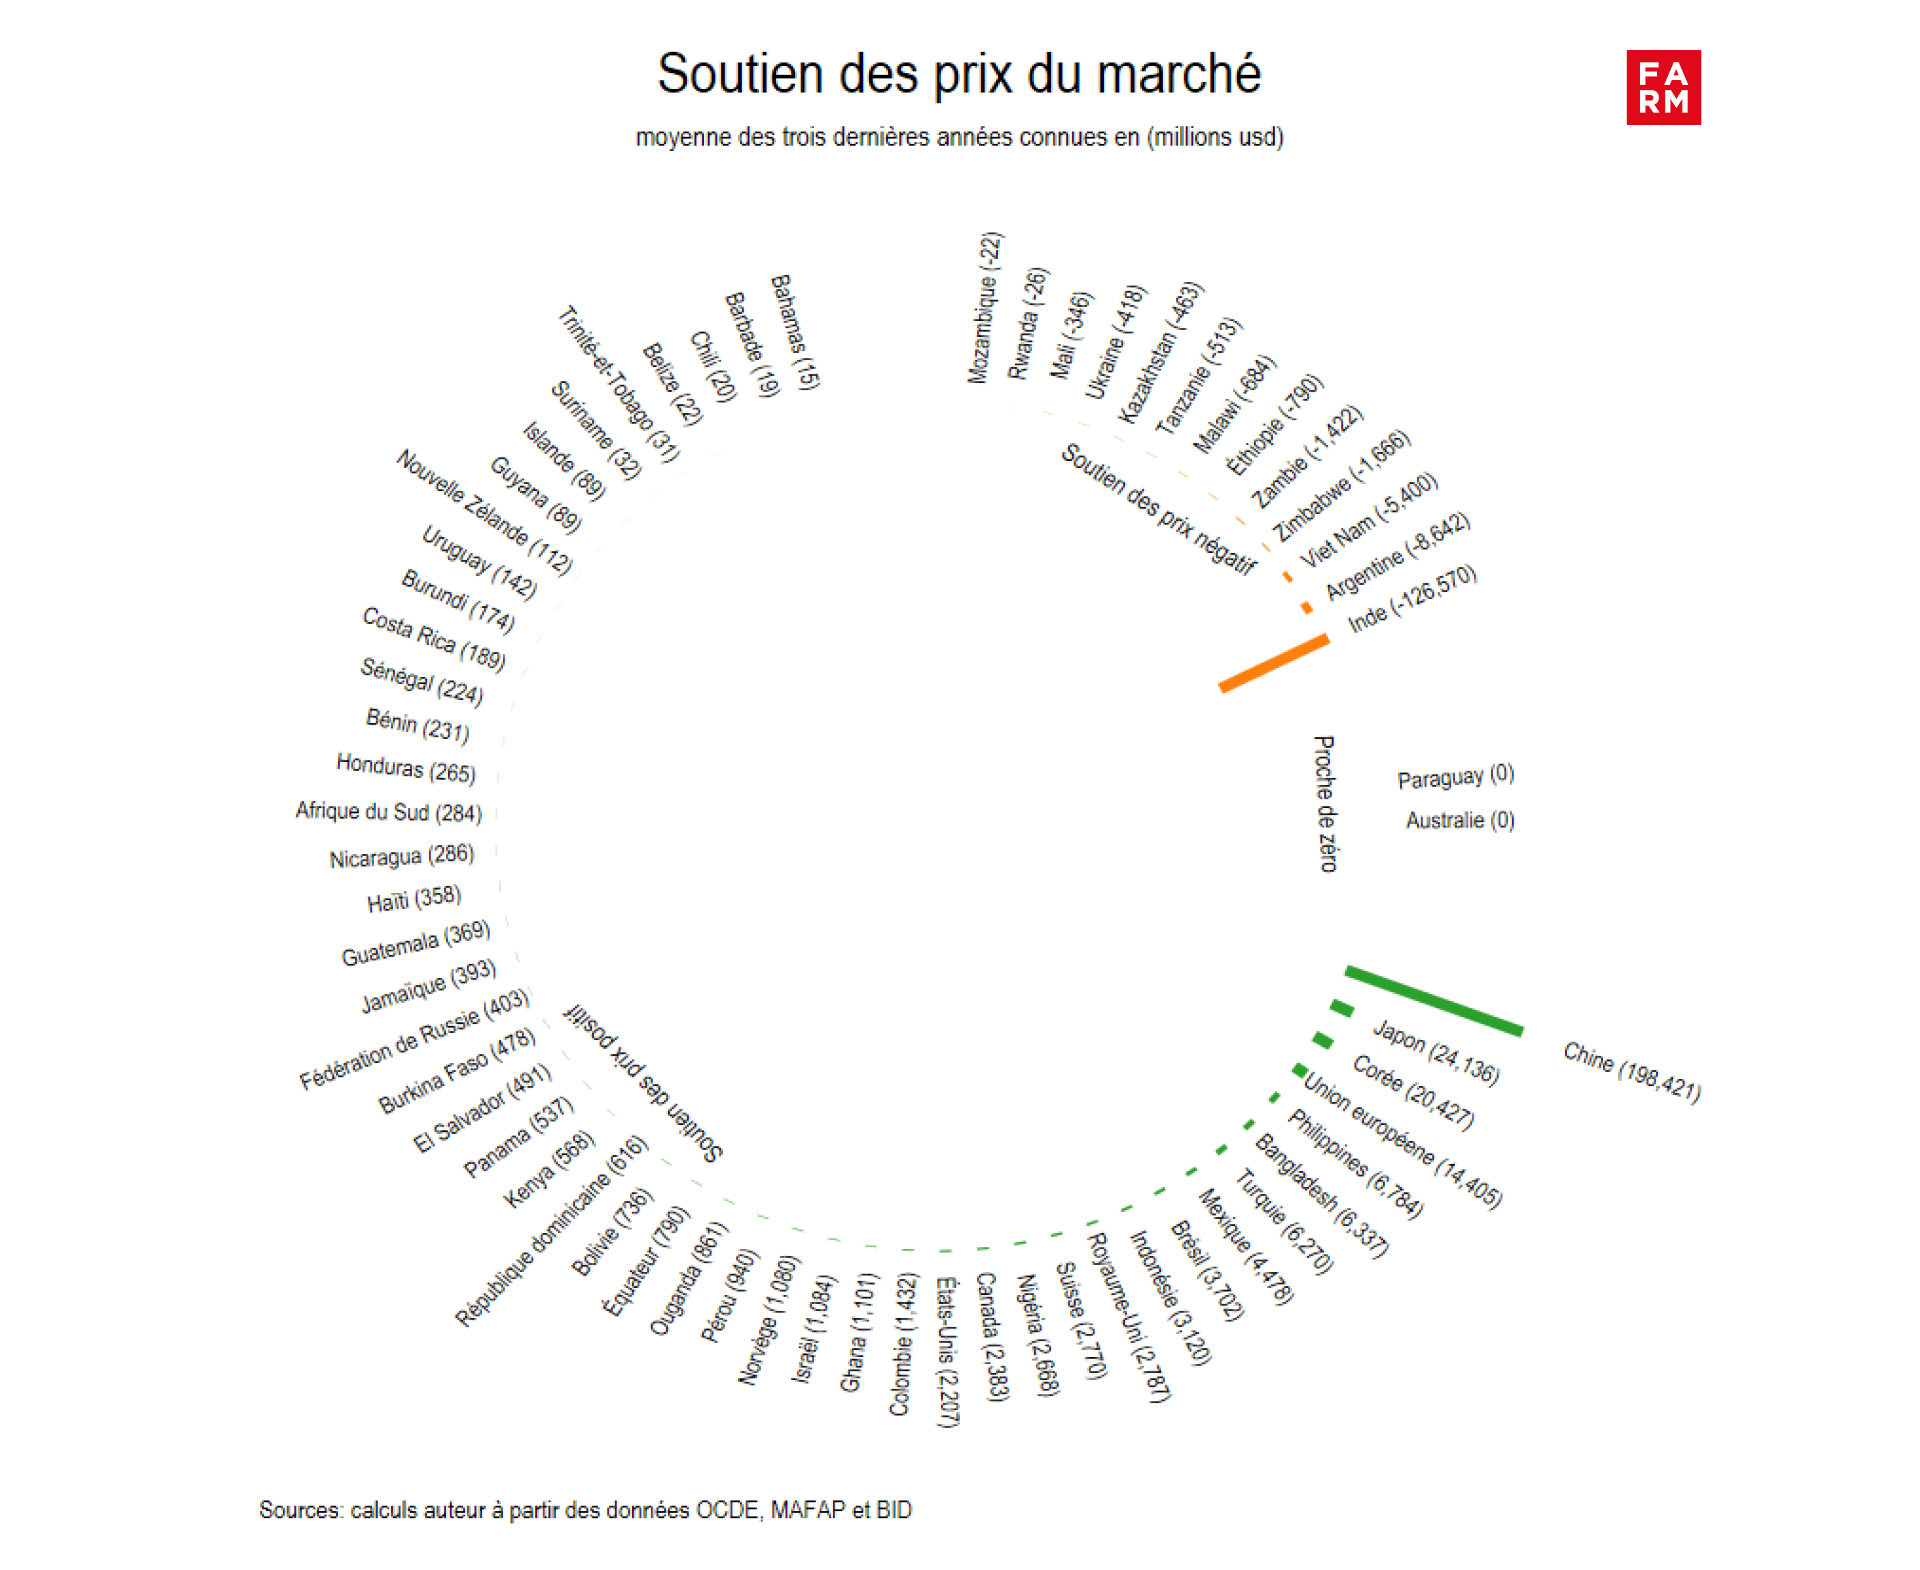
Beyond the regional observation, the country-level analysis highlights the strong heterogeneity of agricultural price support policies at the global level. (Graph 2). It reveals not only the scale of transfers in certain countries, but also the diversity of policy choices associated with this type of support for the sector. agricultural.
The champions of producer support
There China, with an estimated SPM of nearly 200 billion USD, overwhelmingly dominates the ranking, reflecting the massive use of domestic price support instruments, particularly on several strategic products such as the corn (USD 42.3 billion), pork (32.6 billion) or the rice (24.8 billion).She is followed by the Japan (USD 24.13 billion) and the South Korea (USD 20.43 billion) which maintain historically protectionist policies on basic commodities such as rice (USD 7.7 billion) and milk (USD 3.15 billion) for the Japan, Or rice (USD 4.13 billion) and pork (USD 3.3 billion) for the South Korea.
The European Union presents an estimated SPM 14 billion USD, This reflects the continued existence of price support mechanisms in certain agricultural sectors, even though these policies have been partially reformed under the Common Agricultural Policy. The main products concerned are poultry meat (USD 5.9 billion), beef (USD 3.8 billion) and the potato (USD 1.34 billion).
Countries that implicitly tax their agriculture
The most striking case is that of India, with a strongly negative PMS (-126.6 billion USD). This figure is mainly explained by export restrictions and price control mechanisms on several basic commodities, in particular milk (- 54 billion), rice (- 12 billion) and wheat (- 12 billion). The aim is to contain food inflation and protect consumers' purchasing power. However, these measures keep agricultural prices artificially low, reducing producers' potential income.
However, this interpretation needs to be qualified. Public spending on agriculture in India are estimated at nearly 115 billion USD, which tends to mitigate, or even to neutralize, The weight of the SPM in the overall assessment of support to the sector. Depending on the year, the extent of budgetary support can thus partially or totally offset the negative effect of PMS. Overall, this configuration suggests a two-tiered support strategy: on the one hand, price policies aimed at stability and food accessibility, and on the other, budgetary transfers mobilized to preserve agricultural incomes and support production, without abandoning the objectives of price control for consumers.
Other countries also use this lever, either to stabilize domestic prices or to generate tax revenue, at the cost of a negative PMS that penalizes their producers. This is the case of Argentina (-8.6 billion USD) and the Vietnam (-5.4 billion USD), but also of Zimbabwe and of the Zambia. Unlike India, however, public spending there is too low to compensate for the potential loss of income induced by these policies, so the net effect of the support remains unfavorable to producers.
Finally, countries like Australia Or Paraguay are close to equilibrium (PMS close to zero), a sign of weak public intervention and strong commercial openness.
This country-by-country analysis shows that The rationales for intervention in agricultural prices are not limited to regional divisions or income levels alone., contrary to what was observed in the analysis of public agricultural spending. They primarily reflect political, fiscal and social trade-offs specific to each national context, between objectives of purchasing power, stabilization of agricultural income and tax revenues.
Chart 2 – Market price support by country (average of the last three available years, in millions of USD).
The most distorted products
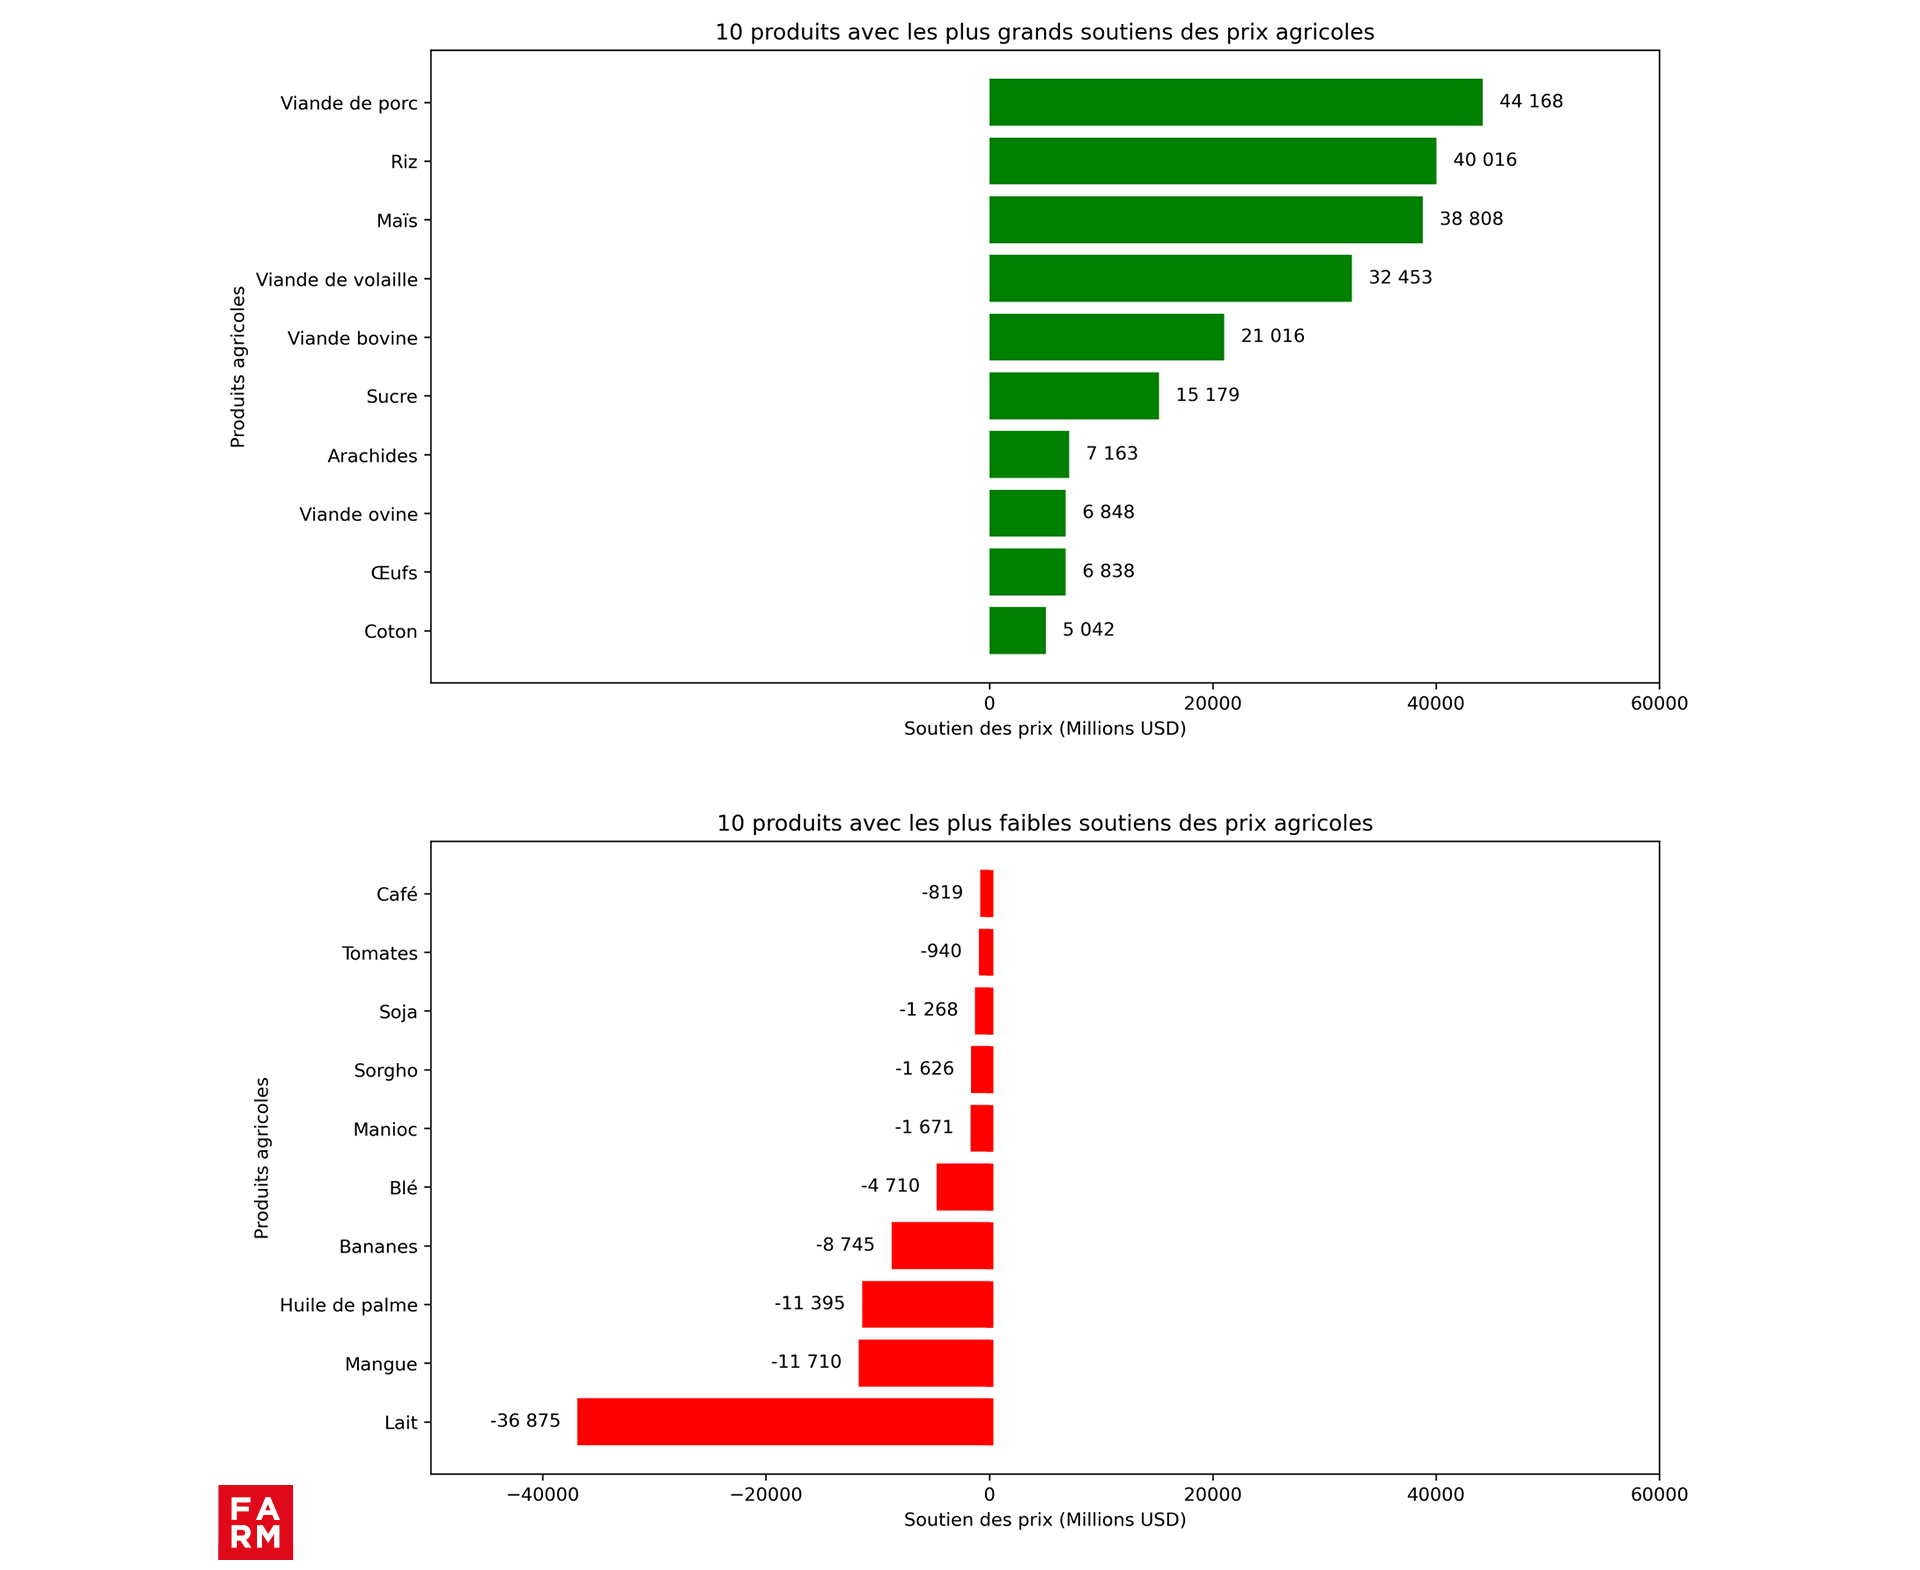
Price distortions do not affect all products in the same way. Some sectors benefit from massive support, while others are subject to implicit taxation. graph 3 presents the ten products benefiting from the highest levels of support, as well as the ten products most heavily subject to a form of implicit levy through domestic prices lower than international prices.
The big winners of price support: animal proteins and cereals
Positive support totals 290 billion USD and are focusing massively on the animal proteins and the strategic cereals. These pillars of food security represent nearly two-thirds of global positive PMS. pork (USD 44.2 billion), of poultry (USD 32.5 billion), of cattle and sheep (USD 27.9 billion), as well as the eggs (USD 6.9 billion) alone account for nearly 40 % of this support. The rice (USD 40 billion) and the but (USD 38.8 billion) represent approximately 27 %. This support often aims to stimulate domestic production and reduce dependence on imports, particularly in densely populated countries, especially in Asia. In addition to these main products, there is also the sugar (USD 15.2 billion), the peanuts (US$7.2 billion), the cotton (5 billion USD) and the rapeseed (USD 4.2 billion).
Dairy and export crops: sectors structurally penalized by pricing policies
Conversely, the milk suffers the highest implicit taxation at the global level (-$36.9 billion)), mainly as a result of policies implemented in India (-$54 billion) to maintain the economic accessibility of dairy products for the population. Export crops such as mango (-11.7 billion USD), palm oil (-11.4 billion USD) or the banana (-8.7 billion USD) They also experience significant negative distortions. In some cases, public intervention often amounts to capturing a portion of the export-related rent, to the detriment of producers.
Chart 3 – Positive and negative market price supports by product (average over the last three available years, in billions of USD).
Sources: Author's calculations based on OECD, FAO-MAFAP, IDB and AgIncentives Consortium data
The SPM reveals a simple truth: behind every price distortion lies a major political choice. Supporting producers, protecting consumers, preserving competitiveness, or collecting revenue through export taxation — no country escapes these trade-offs, but all deal with them differently. The result is a profoundly contrasting global landscape, where some agricultural systems are boosted by prices, while others are implicitly taxed.
In a context of increased volatility, geopolitical tensions, and an urgent ecological transition, these policies can no longer remain static. The question is no longer whether if States need to rethink their support mechanisms, but how make them compatible with the imperatives of sustainability, resilience and equity.
This is precisely what the analysis of the Total Support for Agriculture and Food (TSAF) Understanding, beyond isolated figures, how budgetary transfers and market distortions combine—or contradict each other—to shape the future of food systems. Because agricultural transformation will not only take place in the fields, but also in the way public policies influence market signals.
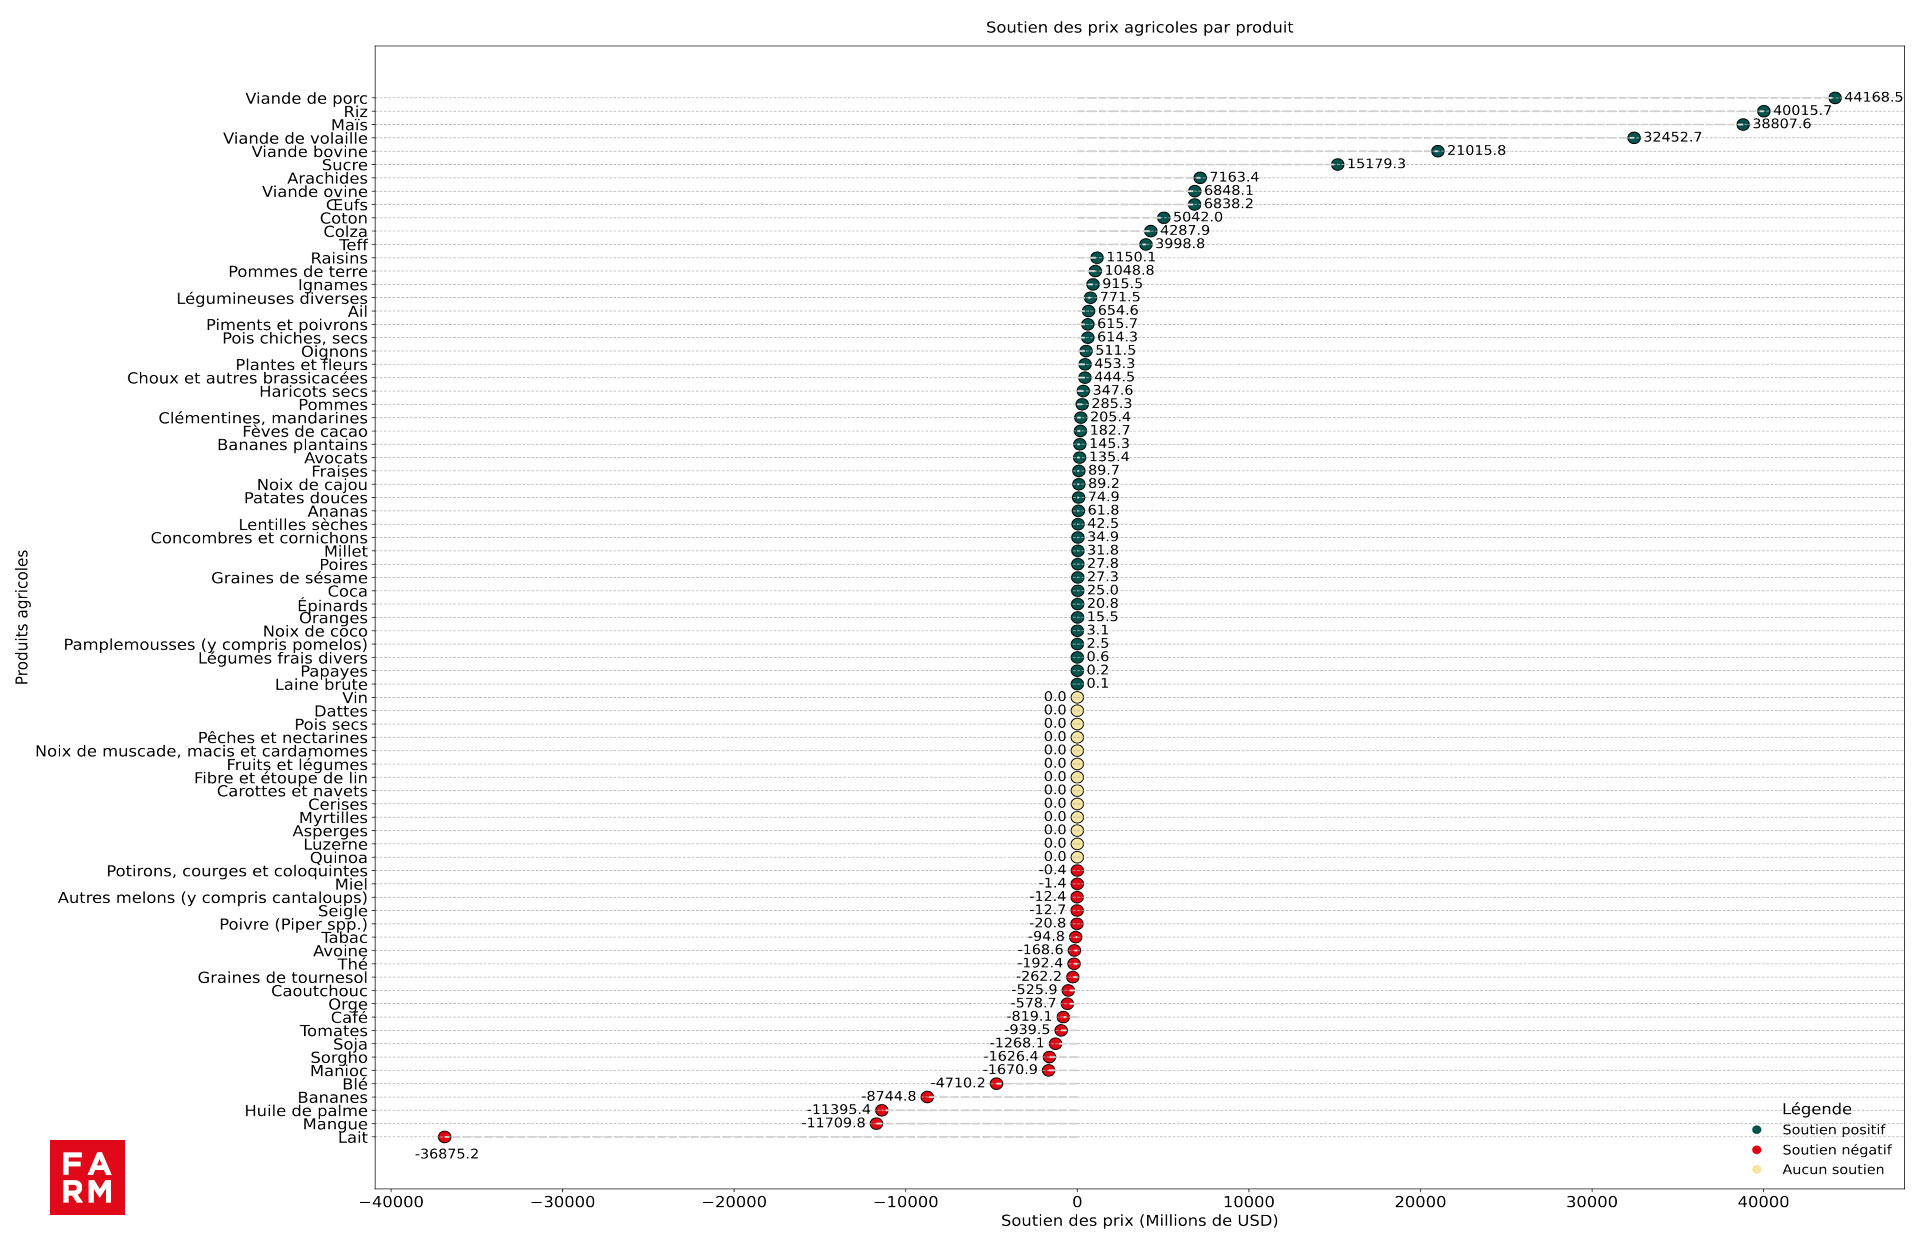
Figure 4: A detailed analysis of SPM by product
Sources: Author's calculations based on OECD, FAO-MAFAP, IDB and AgIncentives Consortium data