Support for agriculture, a coveted windfall (2) The return of multifunctionality
Support for agricultural production can exacerbate the negative impacts of agriculture on the environment, but there is no guarantee that reducing support will promote climate change mitigation and better biodiversity conservation. It all depends on the crop and livestock farming methods, the level of agricultural productivity, and the climate footprint of the diet. The political trade-offs between the multiple functions of agriculture—food security, environmental preservation, producer income, etc.—are specific to each country, but they interact on a global scale.
As mentioned in our first article, the most commonly used indicator for assessing agricultural support is the Producer Support Estimate (PSE), calculated by the OECD (Organisation for Economic Co-operation and Development). The OECD has established a typology of different types of support according to their potential environmental impact. The word "potential" should be emphasized, as the OECD recognizes that the actual environmental impact of support depends on many factors, "such as the application or not of production quotas and strong eco-conditionality requirements"[1]. THE "measures that may be most harmful" are those that provide the greatest incentive to produce, at the risk of increasing the negative externalities of agriculture: market price support, production payments and subsidies for variable inputs (such as water, fertilizers or plant protection products) granted without environmental constraints on agricultural practices. These aids currently represent half of the PSE. Other agricultural support measures are considered less harmful, neutral or beneficial for the environment, depending on whether they are more or less decoupled from production, subject to environmental constraints on agricultural practices or aim to achieve specific agri-environmental objectives[2] (chart).
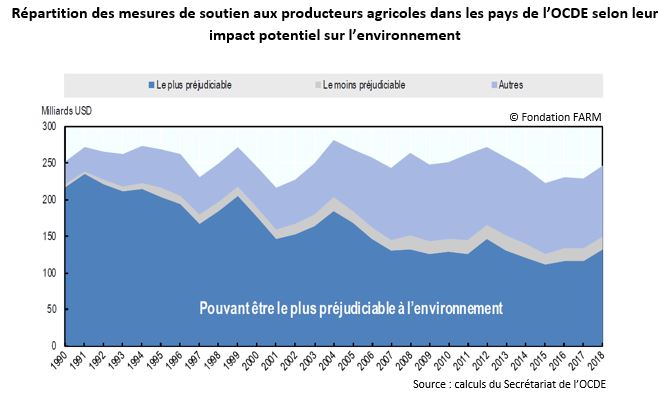
Note: The forms of support to agricultural producers considered to have the most adverse environmental effects are: market price support; payments based on commodity output without environmental constraints on farming practices; and payments based on the use of variable inputs without environmental constraints on farming practices. The forms of support considered to have the least adverse (or beneficial) effects are: payments based on area, number of animals, receipts, or income with environmental constraints; payments based on input use with environmental constraints; and payments based on non-commodity criteria. The category "other" contains types of support that do not fall into the first two. For explanations of the methodology, see Chapter 4 of OECD (2013), “Policy Instruments for Green Growth in Agriculture”, OECD Green Growth Studies, OECD Publishing.
Redirect aid
The amount of measures considered most harmful to the environment in OECD countries averaged $112 billion per year over the period 2017-2019.[3]If we include the twelve non-OECD emerging economies (including Brazil, India and China) for which the OECD estimates agricultural support, this figure can be extrapolated to $230 billion per year.[4]By comparison, support for fossil fuels in 77 OECD or G20 member countries totaled $478 billion in 2019.[5].
This observation is leading a growing number of experts to call for the elimination of the most environmentally harmful subsidies, the proceeds of which could be used to finance measures that have less of an incentive effect on agricultural production. The aim is to reduce agricultural pollution, including greenhouse gas emissions, and to encourage farmers to better conserve soil, flora, and fauna.[6]However desirable it may be from the point of view of collective well-being, this reorientation of support raises several questions.
What budget is available?
Nearly 90 % of the aid considered to be potentially most harmful to the environment, or more than 40 % of the PSE in OECD countries, consists of market price support.[7]These subsidies correspond to the difference between domestic and world prices of agricultural products resulting from border protections; they are not budgetary expenditures that could be redeployed towards “greener” payments.
In other words, if market price support were removed, only 60 % of the support recorded in the PSE could actually be redistributed to farmers in the form of subsidies, to compensate for the resulting reduction in agricultural production. If we wanted to fully compensate for the reduction in income due to the reduction in aid per farm, we would have to mobilize new financing and therefore increase agricultural subsidies in the countries concerned[8].
Carbon and biodiversity leakage
The OECD's classification of support measures according to their potential environmental impact exactly matches its typology of support according to its potential for market distortion: in both cases, it is the incentive to produce that is designated as the "culprit." One might naively conclude that there is a perfect correspondence between improving the environment and removing support for agriculture. This is not the case.
Indeed, eliminating all the most environmentally harmful support measures would lead to an increase in the production of some agricultural products and a decrease in that of others. If, for example, the increase in greenhouse gas (GHG) emissions accompanying the increase in production is greater than the decrease in GHG emissions linked to the decrease in production, climate change will continue to worsen. One factor plays a key role here: the intensity of GHG emissions per product, i.e., the average quantity of GHG emitted per kilo of product.
This intensity itself results from two parameters:
– methane flows, emitted by livestock and rice, and nitrous oxide, mainly from the use of nitrogen fertilizers on cultivated soils. These flows, in CO2 equivalent, are on average much higher for ruminant meats (cattle, sheep) and rice. However, these productions generally have the highest support rates[9] ;
– the variation in carbon stocks in soils resulting from land use changes due to agriculture. These stocks are reduced, leading to an increase in CO2 emissions, when increased agricultural production comes at the expense of forests and grasslands, as observed in Latin America, sub-Saharan Africa and Southeast Asia.
Liberalizing agricultural policies can thus result in carbon and biodiversity "leakage." The geographic distribution of economic gains and losses from reducing market distortions does not necessarily correspond to that of environmental gains and losses, which can significantly complicate the negotiation of trade agreements when considering their implications for climate and biodiversity.
Also play on demand
The intensity of greenhouse gas emissions per product is not the only factor determining the impact of agriculture on the environment. It is also necessary to take into account the agricultural production method, which is more or less demanding in chemical inputs, and the level of agricultural productivity, which can mitigate or even completely offset the impact of the production method on the climate footprint.[10].
Finally, diet is crucial, as it includes more or less products with high GHG emissions. Thus, in France, it does not seem possible to convert all cultivated land to organic farming, due to the lower yields it provides, without substantially reducing meat consumption.[11]Reconciling agriculture and the environment requires at least as much a policy aimed at influencing the quantity and quality of food demand as a policy focused on agricultural production.[12].
The return of multifunctionality
Since the impact of agriculture on the environment is closely linked to agricultural production, any reduction or transformation of support has induced effects, both positive and negative, on food and nutritional security, agricultural income (in its own right and compared to urban income), employment, territorial balances, the quality of landscapes and other amenities. This is a long-standing debate, in force at the beginning of the 1990s, which then focused on the compatibility between the liberalization of agricultural policies within the trade negotiations of the "Uruguay Round" on the GATT[13] and the preservation of the multiple functions of agriculture.
The context has changed, but the debate continues. Political decisions in this area depend on government priorities, but they interact on a global scale. The imperative to increase agricultural production in sub-Saharan Africa generates the risk of increased deforestation, accelerating climate change. The public policy reforms envisaged in Europe to better address environmental concerns will affect its ability to contribute to global food balances. They will also indirectly influence the rate of expansion of cultivated areas and therefore CO2 emissions in other exporting countries (Latin America, Canada, Russia) and in countries importing agricultural products, particularly south of the Sahara. In any case, an ecological intensification of production aimed at achieving economic, social, and environmental "triple performance," driven by both public policies and agri-environmental services markets, can enhance the multifunctionality of agriculture, now considered within the framework of the globalization of public goods, as well as that of economies.
[1] OECD, 2013. “Policy Instruments for Green Growth.” OECD Green Growth Studies.
[2] Henderson, B. and J. Lankoski, 2019. “Evaluating the environmental impact of agricultural policies.” OECD Food, Agriculture and Fisheries Papers, No. 130.
[3] Including the five non-OECD Member States of the European Union. Source: OECD, 2020. “Biodiversity and the Economic Response to COVID-19: Ensuring a Green and Resilient Recovery.”
[4] Deutz, A. et al., 2020. “Financing Nature: Closing the global biodiversity financing gap”. The Paulson Institute, The Nature Conservancy, and the Cornell Atkinson Center for Sustainability.
[5] OECD, 2020, op.cit.
[6] See for example: Searchinger, T. et al., 2020. “Revising Public Agricultural Support to Mitigate Climate Change.” Development Knowledge and Learning, World Bank; Barrett, C. et al., 2020. “Socio-technical Innovation Bundles to Agri-food systems Transformation”. Report of the International Expert Panel on Innovations to Build Sustainable, Equitable, Inclusive Food Value Chains. Ithaca, NY, and London: Cornell Atkinson Center for Sustainability and Springer Nature.
[7] Over the period 2009-2011, market price support accounted for 86 % of the potentially most environmentally damaging measures, which themselves constituted 50 % of the PSE (OECD, 2013, op.cit.). These proportions have remained relatively stable for ten years.
[8] For information purposes, in OECD countries, the PSE represented on average 20 % of the value of agricultural production over the period 2017-19. The removal of an amount of aid equivalent to 40 % of the PSE, in the event of the elimination of market price support, mechanically equates to a reduction in market revenues of 8 %. This percentage naturally varies according to production and country.
[9] Mamun A. et al., 2021. “Reforming Agricultural Support for Improved Environmental Outcomes.” Appl Econ Perspect Policy. 2021 ; 1-30.
[10] A kilo of wheat produced with few synthetic fertilizers and phytosanitary products but with a low yield per hectare can have a higher GHG emissions intensity than wheat produced with more chemical inputs but with a higher yield.
[11] Barbier, C. et al., 2020. “Soil, energy and carbon footprints of food”, report for Ademe.
[12] Guyomard, H., Bureau J.-C. et al., 2020. “Research for AGRI Committee – The Green Deal and the CAP: policy implications to adapt farming practices and to preserve the EU's natural resources”. European Parliament, Policy Department for Structural and Cohesion Policies, Brussels.
[13] General Agreement on Tariffs and Trade, signed in 1947 by 23 countries. The Uruguay Round negotiations, involving 123 countries, began in 1986 and concluded with the signing of the Marrakesh Agreement in 1994.