Public spending to support agriculture and food: a rich country issue?
After going online in 2022, the FARM Foundation's Global Observatory of Public Support for Agriculture and Food is undergoing new developments, with the release of new data! After the first analyses published, FARM offers an in-depth and renewed look at state interventions in the field of agricultural and food support. How much and in what forms do states spend to support their agricultural and food sectors, but also what support gaps can be observed between countries?
An enhanced knowledge platform on public support for agriculture
The Observatory offers new analyses based on updated data from recognized sources (OECD, IDB, MAFAP-FAO) and is enriched by the addition new countries [1] thanks to data from the MAFAP program. It allows for a more detailed analysis of trends and gaps in support between countries, providing decision-makers and stakeholders in the agricultural sector with essential understanding to design more effective and fair support policies.
The Observatory now covers 45 high-income countries, 39 middle-income countries, and 9 low-income countries, together accounting for more than 90% of the value of global agricultural production. Data spans from 1986 to 2022, depending on the country.
The Observatory's analyses continue to be structured around three key indicators: Public expenditure on support for agriculture and food, THE Market price support (measures creating a gap between the domestic price and that of international markets), and the Full support for agriculture and food (link to the methodological note). This first part of the FARM Observatory's analysis focuses on public spending to support agriculture.
[1] The new countries are: Mauritania, Niger, Nigeria, Seychelles and Bangladesh
More than 542 billion $ of global public spending on agriculture and food
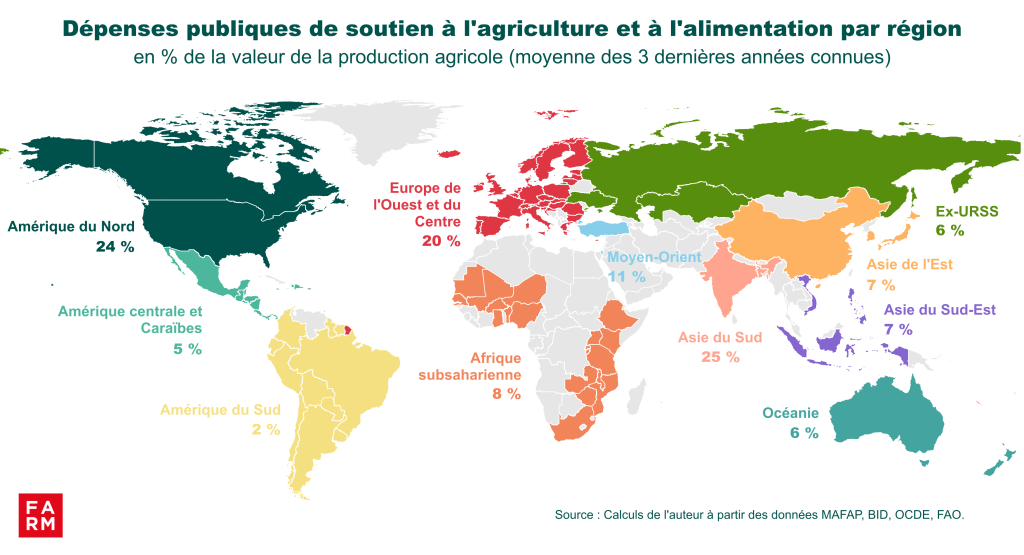
The amount of global public spending directed towards supporting agriculture and food, calculated on the average of the last three known years, amounts to to more than 542 billion US dollars (USD). Nearly 90 % of this amount is concentrated in four major regions: in the lead East Asia (130 billion), North America (125 billion), South Asia (119 billion), and Western and Central Europe (106 billion) (graph 1).
Chart 1
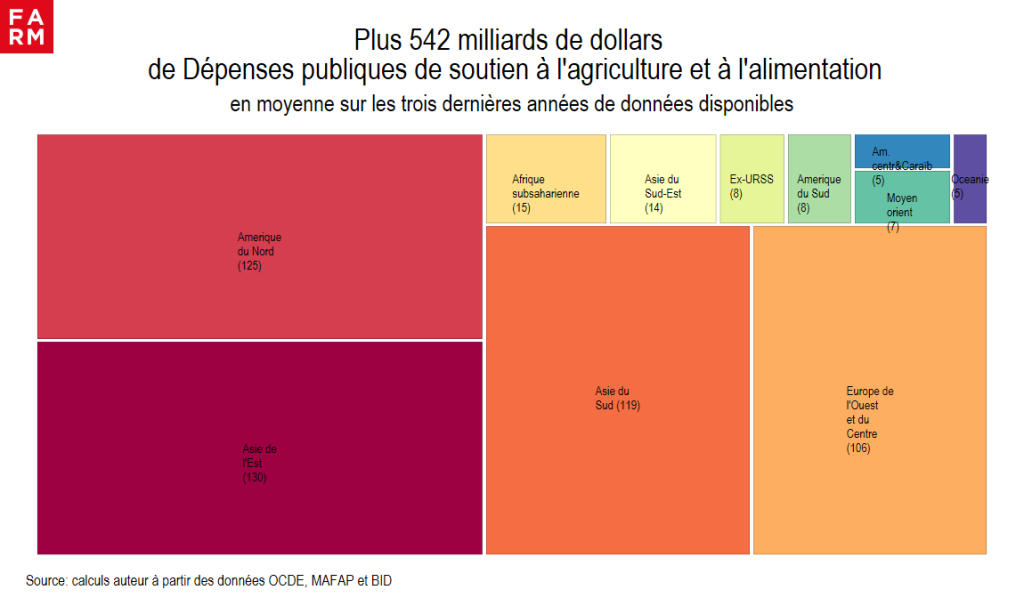
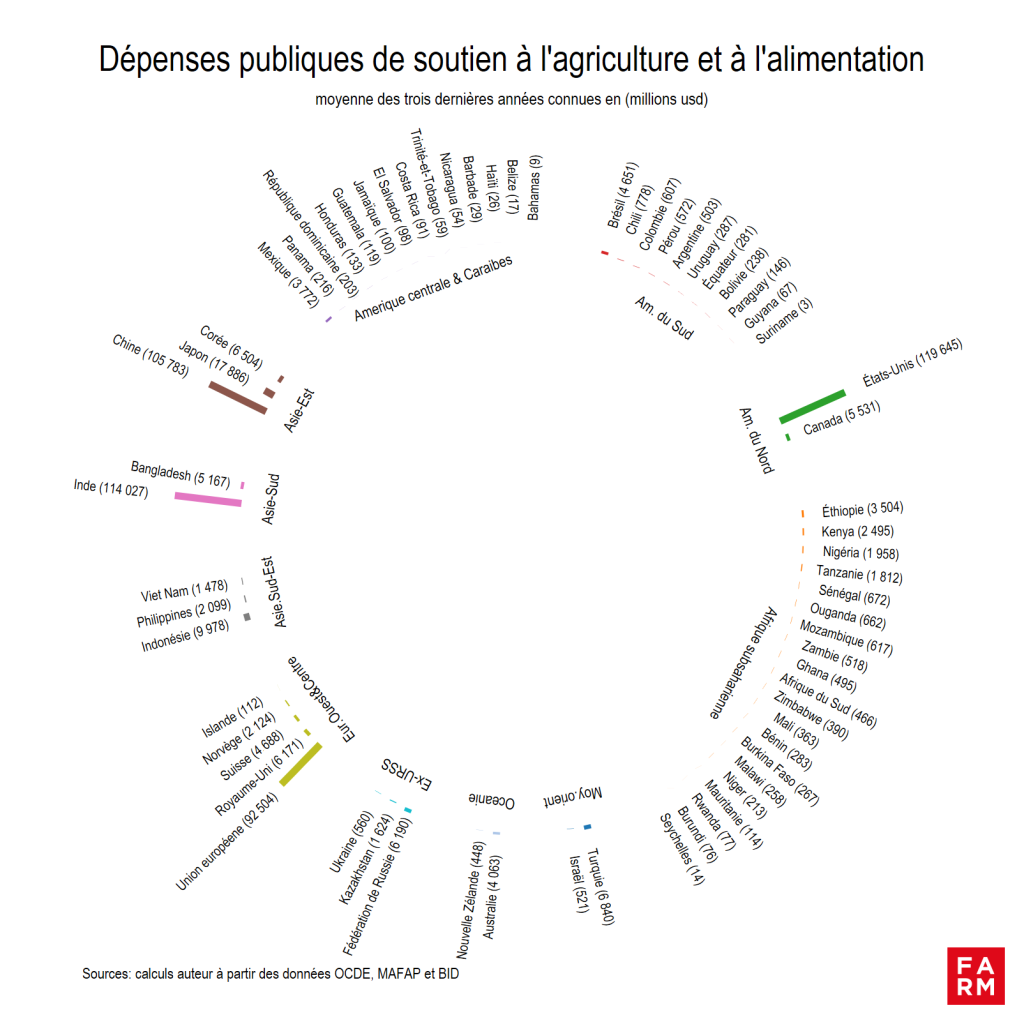
Chart 2 presents the details of these expenses calculated on the average of the last three years by country and expressed in millions of USD within 11 regional groupings. In East Asia, China is the country that spends the most to support its agriculture with more than , representing a major share of public support spending in this region. In North America, the United States dominate with USD 119 billion, followed by Canada with 5.5 billion USD. For South Asia, India is the largest contributor with USD 114 billion. The bloc formed by the European Union occupies an important place with 92.5 billion USD, followed by United Kingdom (6 billion USD).
As the graph shows, Brazil, Mexico, Ethiopia, Turkey, Russia, Australia and Indonesia are the countries that spend the most to support the agricultural and food sectors in their respective sub-regions.
Chart 2
The gaps in public spending on agricultural support between major regions (East Asia, North America, South Asia, Western and Central Europe) and the rest of the world are considerable. These differences reveal profound differences in fiscal capacity and strategic priorities between countries. The richest and most industrialized regions allocate much larger sums to support their agricultural sectors, while lower-income regions, such as sub-Saharan Africa, have limited means to finance this type of support, even though agriculture is a key sector of their economies and food insecurity remains a serious public problem.
Over the past two years (see the analyses of the FARM Foundation), global public spending on agriculture and food support has changed little. The global panorama remains dominated by rich, industrialized countries, which, although less dependent on agriculture, invest more in this sector.
These disparities make comparisons between countries and regions difficult if we consider only the gross amounts of public spending. To facilitate comparisons, we will relate these amounts to the value of each country's agricultural production. This makes it possible to measure the intensity of support, or in other words, the financial effort made by a state, regardless of its level of wealth, to support its agriculture.
South Asia, North America and Europe lead the way with financial efforts well above the global average
When compared to the value of agricultural production, the analysis of public expenditure also shows significant differences in the intensity of support between countries and regions. At the global level, the financial efforts made by governments to support agriculture represent on average 14% of the value of global agricultural production. Regions such as North America, South Asia, and Western and Central Europe stand out for their strong financial commitment to agriculture. (graph 3). Indeed, South Asia has one of the highest rates of public agricultural expenditure, representing 25% of the value of its primary production.. Just behind South Asia, North America devotes 24 billion of the value of its agricultural production to finance its agricultural sector. With support of 20 billion, Europe also stands out for its financial commitment to agriculture. However, it should be noted that the 2003 reform of the Common Agricultural Policy (CAP), implemented in the following years, led to a reduction in public agricultural spending. This decrease is explained in particular by the decoupling of aid, previously linked to agricultural production. Thus, public agricultural spending fell from 27 billion of the value of agricultural production in 2006 to only 17 billion in 2022.
Conversely, regions such as Sub-Saharan Africa (8 %) or South America (2 %), despite a significant dependence on agriculture for economic growth and food security, show lower support, due to budgetary constraints and/or strategies oriented towards other support mechanisms, notably through the market.
Chart 3
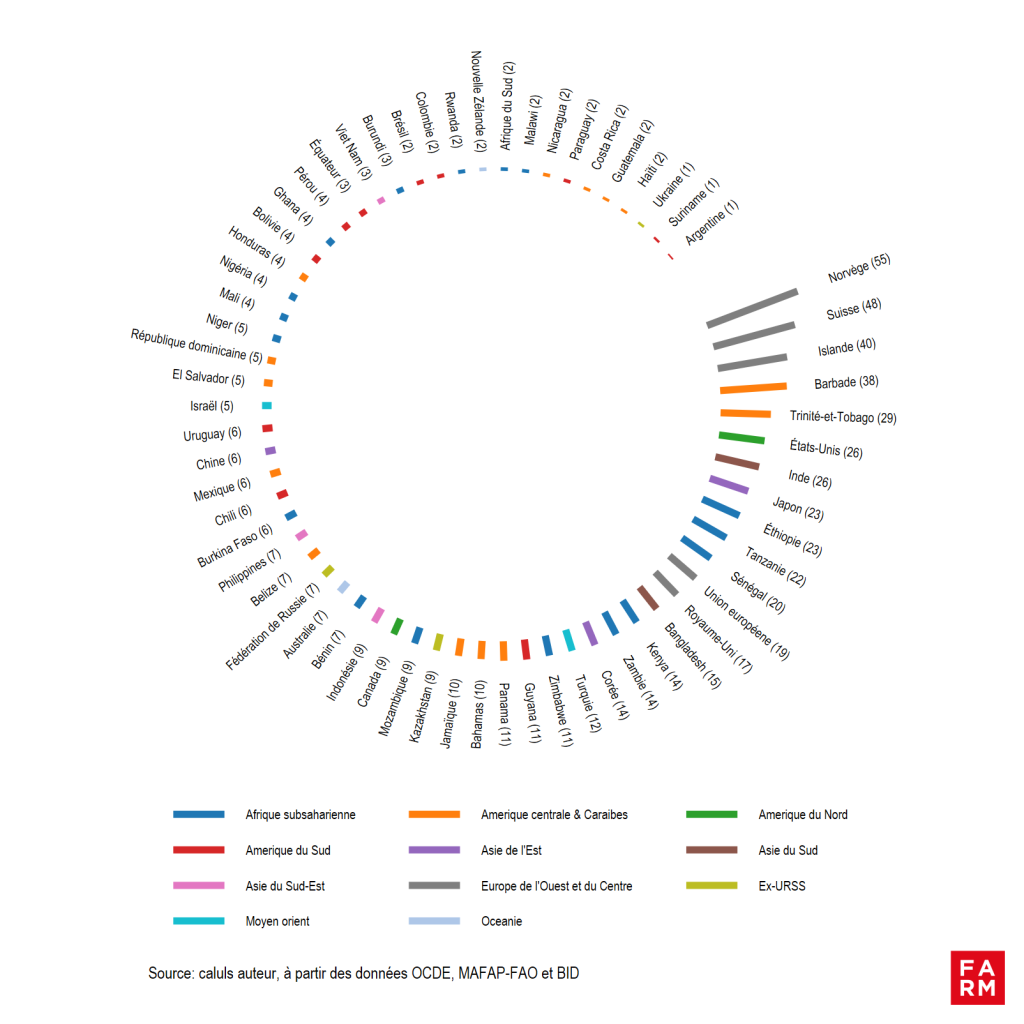
Nordic countries, champions in terms of intensity of public spending on support for agriculture
THE graph 4 presents a detailed view of the efforts made by each country to support their agriculture, expressed as a percentage of agricultural production. Norway, Switzerland, and Iceland stand out with high levels of support, reaching 55 %, 48 %, and 40 % of agricultural production, respectively. Among the major agricultural economies, the United States and India also show significant support, each at 26 %. Some countries in sub-Saharan Africa also show notable public commitment. In Ethiopia, Tanzania, and Senegal, governments devote 23 %, 22 %, and 20 % of the value of their agricultural production to support the sector, which demonstrates a significant financial effort for these countries compared to other countries in the region. In contrast, China, which accounts for nearly 20 billion USD of the global public expenditure on agriculture, has significantly lower relative support, representing only 6 billion USD of the value of its agricultural production, an intensity half that of the global average.
Chart 4: Detailed overview by country: Public expenditure on support for agriculture and food in each country, in % of the value of agricultural production
Different approaches or strategies for spending in agriculture
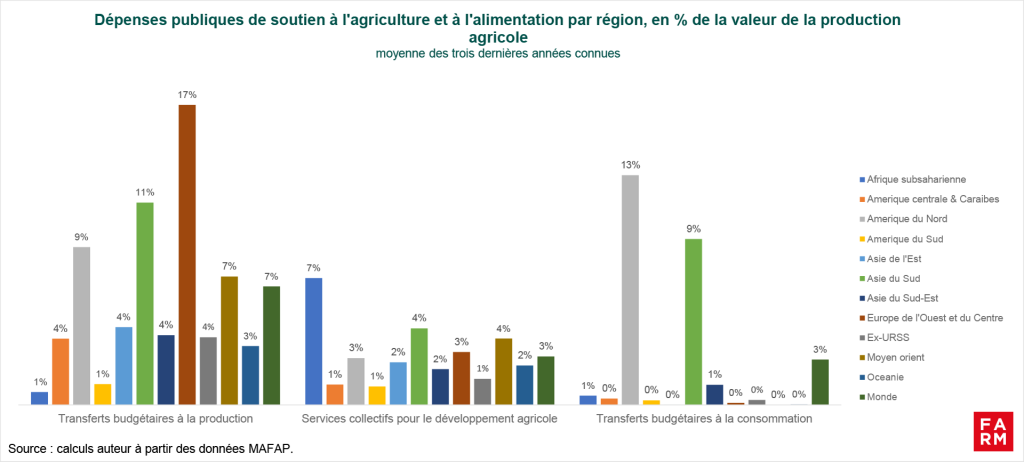
3/5 of global public expenditure on support for agriculture and food is budgetary transfers encouraging production or intended for producers
Public support expenditure is divided into three main categories: budgetary transfers to production, budgetary transfers to consumption and collective services (infrastructure, training, research and extension, etc.) for agricultural development. (chart 5)Each region has its own priorities and adopts distinct strategies. Public expenditure analysis allows us to account for these options and objectives: directly supporting production, competitiveness and producers' income; making agricultural products more affordable for consumers; or investing in the development of rural infrastructure and services dedicated to agricultural development. The distribution of expenditure therefore reflects different priorities that respond to the specific needs of the countries but also to the legacy of public agricultural policies, as indicated by the debates relating to the reforms of the Common Agricultural Policy within the EU.
For example, the United States devotes more than half (55 %) of its public agricultural expenditures to consumer support. The objective is to guarantee more affordable agri-food products for consumers, notably through large food subsidy programs such as SNAP (Supplemental Nutrition Assistance Program), better known as Food Stamps, or the National School Lunch Program. These policies indirectly contribute to supporting agricultural production. Transfers to production are also significant, accounting for 35 % of expenditures devoted to the sectors, while collective services for agricultural development are relatively low (10 %). Across the border, in Canada, only 2 % of agricultural expenditures are devoted to consumption; the rest is directed overwhelmingly towards production (65 %) and collective services (33 %).
In South Asia, the approach can also vary from one country to another. India devotes 46 billion and 39 billion of its agricultural expenditures to encouraging consumption and production, respectively. Bangladesh, for its part, prioritizes support for collective services (62 billion of expenditures), while fiscal transfers to production represent 31 billion.
In Western and Central Europe, priority is generally given to transfers to production, which represent 85 % of agricultural expenditure, showing direct support to agricultural producers through aid from the Common Agricultural Policy for European Union countries. Collective services for agricultural development are limited to just under 15 %, while there are practically no transfers oriented towards consumer support.
In sub-Saharan Africa, the bulk of public spending (nearly 90 %) is directed towards collective services for agricultural development. This shows an approach focused on infrastructure and the general development of the sector rather than on direct subsidies to production or consumption. These expenditures are certainly necessary but constitute indirect support to production composed mainly of rural service expenditures (health, education, roads, etc.) as we showed in the analysis published in 2022 (find the 2022 analysis here).
Chart 5:
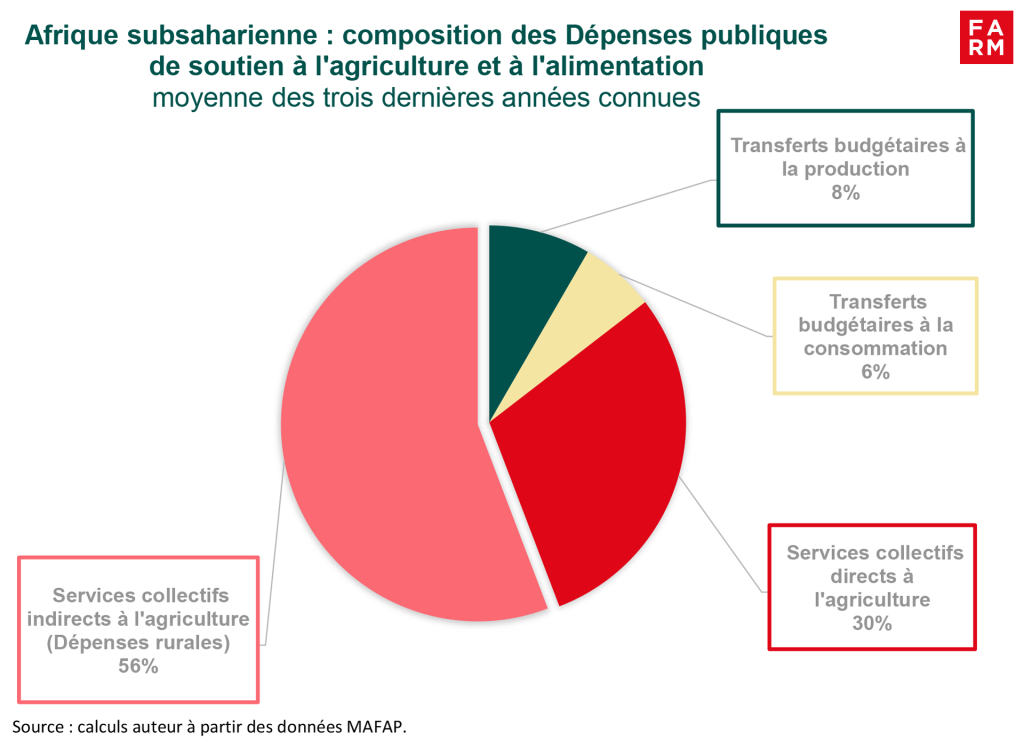
Perspectives on Sub-Saharan Africa
As in other regions, public expenditures in support of agriculture and food have changed very little in sub-Saharan Africa. Furthermore, the detailed data available for this region are relatively sparse and concern mainly West and East Africa. Thanks to the efforts of FAO's MAFAP Programme, the number of countries covered has increased to 19 with the addition of Mauritania, Niger, Nigeria, and Seychelles.
The bulk of public expenditure on public support for agriculture and food in sub-Saharan Africa remains overwhelmingly oriented towards the provision of collective services for the development of the agricultural sector and rural areas. Collective services represent 86 % of total agricultural budgetary expenditure, but two-thirds (56 %) of this expenditure does not directly target the agricultural sector. This includes, for example, rural expenditure on health, education, infrastructure, etc. However, this rural expenditure is essential and contributes indirectly to the development of the agricultural sector, as the majority of rural populations work in this sector. (chart 6).
Transfers targeting production are low (8 %) and the trade policies implemented reduce or even cancel out the effects of support to producers. These trade policies are often oriented towards maintaining affordable food for consumers (see previous analyses on urban bias). These trade policies favor imports of food products whose prices are more competitive than those of local products. In some countries such as Rwanda or Mali, budgetary transfers granted to producers do not compensate for the negative effects of trade policies (the third part of the Observatory's analyses on Total Support will return to these cases in detail).
Chart 6
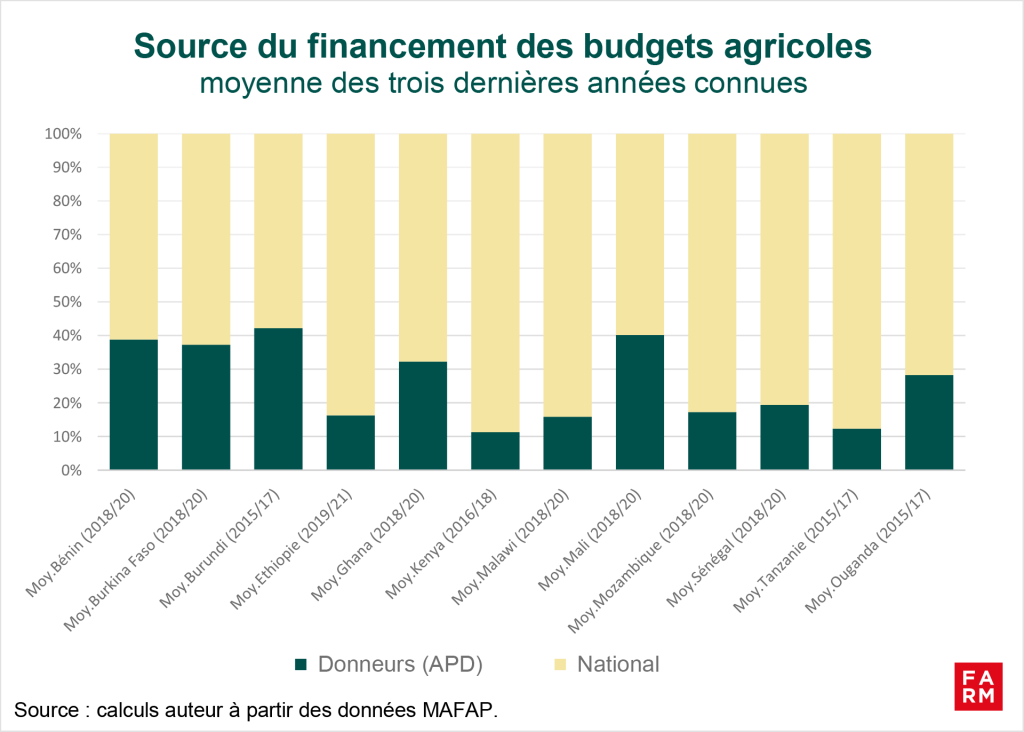
Significant aid dependence in times of budget crises among donors
Furthermore, as indicated by the graph 7, it is important to note a certain dependence of agricultural budgets on international aid. Between 10 and 40 % of agricultural expenditures come from the support of donors and technical and financial partners. Such dependence can harm the efficiency and sustainability of agricultural strategies in different countries, particularly in a context marked by donor budget constraints.
Indeed, a strong trend towards disengagement is underway today, particularly in France, where the Barnier government is planning a 34% reduction in resources allocated to official development assistance (ODA). While the planned reduction is the most significant in France, other European countries, such as Germany, Finland, and Great Britain, have also initiated this reduction. The European Union, which is also a major donor, will also reduce its support to vulnerable countries, with a planned 35% reduction in its funding allocated to the Least Developed Countries over the period 2025-2027 compared to the previous period.
Chart 7
From Maputo to Kampala: Mixed results
In 2003, at the Maputo Summit in Mozambique, African Union heads of state committed to allocating at least 10 billion of their public budgets to the agricultural sector, with the ambition of achieving annual growth of 6 billion. The leaders sought to position the primary sector as a driver of the continent's economic and social development. This commitment, made under the Comprehensive Africa Agriculture Development Programme (CAADP), was renewed in 2014 in Malabo, Equatorial Guinea.
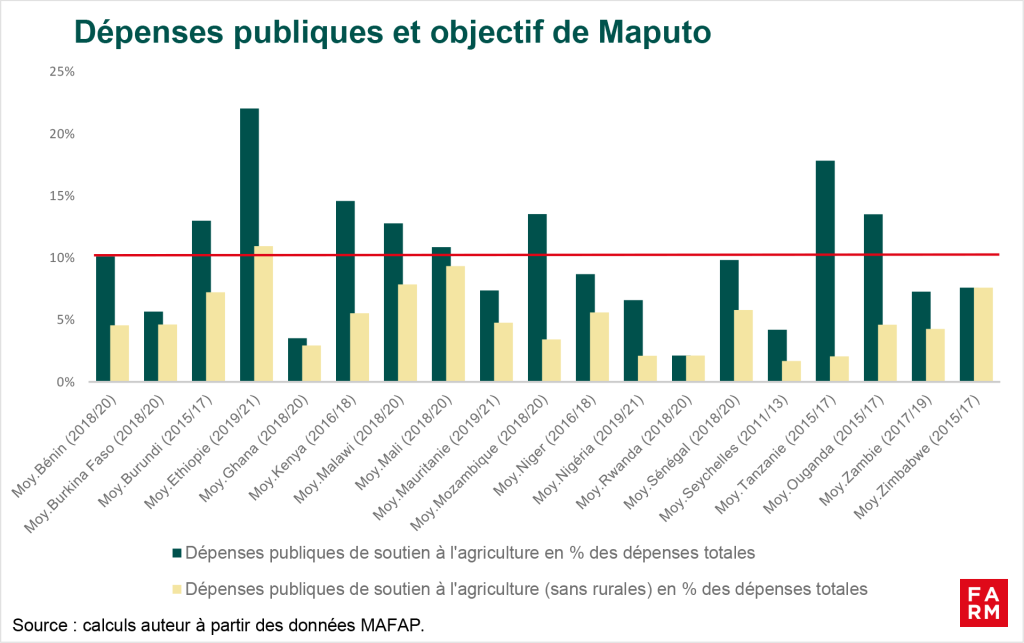
However, fiscal realities show that many countries are struggling to meet this commitment. According to the MAFAP data we analyzed, out of 19 countries, only 9 have met the minimum target of 10,% of public spending on agriculture and food. Excluding rural spending, which is considered indirect support to the agricultural sector, only Ethiopia is fully meeting its commitments to the Maputo target. (chart 8)These data lead, in fact, to questioning the means implemented as well as the commitment and willingness of African States to effectively support their agriculture.
From January 9 to 11, 2025, Kampala will host the Extraordinary Summit of Heads of State and Government of the African Union. This summit will be dedicated to the adoption of the new CAADP Strategy and Action Plan for the period 2026-2035. This meeting represents a crucial opportunity for member states to reaffirm their commitment to agricultural development and define concrete actions to achieve the set objectives. It is imperative that the discussions result in solid financial commitments and rigorous monitoring mechanisms to transform promises into tangible achievements for the African agricultural sector.
Chart 8