The more countries depend on agriculture, the less they support it
Various policies are being implemented to enable the development of the agricultural and agri-food sector across the planet. But what exactly do we know about government interventions in agriculture, the resources they devote to it, and the effectiveness of their actions? A first observation: the more countries depend on agriculture, the less they support it.

The context of multiple crises has put agriculture back at the top of the list of strategic priorities for states, regardless of their income level. They are now seeking to increase their food sovereignty, which generates high expectations for public agricultural policies. These policies must ensure food security, fulfill social and economic functions, particularly for producers, and encourage the adoption of environmentally friendly practices. What support measures for agriculture and food are being implemented today to fulfill these different missions?
With his Observatory, FARM Foundation offers an analysis tool State interventions that allow for comparison of support gaps across the planet. This publication is the first in a series that will analyze the various indicators presented by FARM on its Observatory.
A knowledge platform on public support for agriculture
In order to provide a global vision of the measures used to develop agriculture, The FARM Observatory aggregates different data sources (OECD, IDB, MAFAP-FAO) for 44 high-income countries, 36 middle-income countries and 8 low-income countries over a long period of time. These countries represent approximately 90 % of global agricultural production. Three key indicators are compared. THE public spending support for agriculture and food, the market price support, that is, measures that contribute to creating a gap between the domestic price and that of international markets, and finally full support for agriculture and food. Details on the methodology and indicators are available here.
Who spends the most on agriculture?
There are very large global disparities in public support for agriculture and food. Overall, The higher the income a country has, the more it spends to support its farmers. (as a proportion of the value of agricultural production) while agriculture now provides only a minor part of employment and economic growth in the country. Thus, in high-income countries, the intensity of these expenditures is more than twice that of middle-income countries (9 %) and low income (10 %).
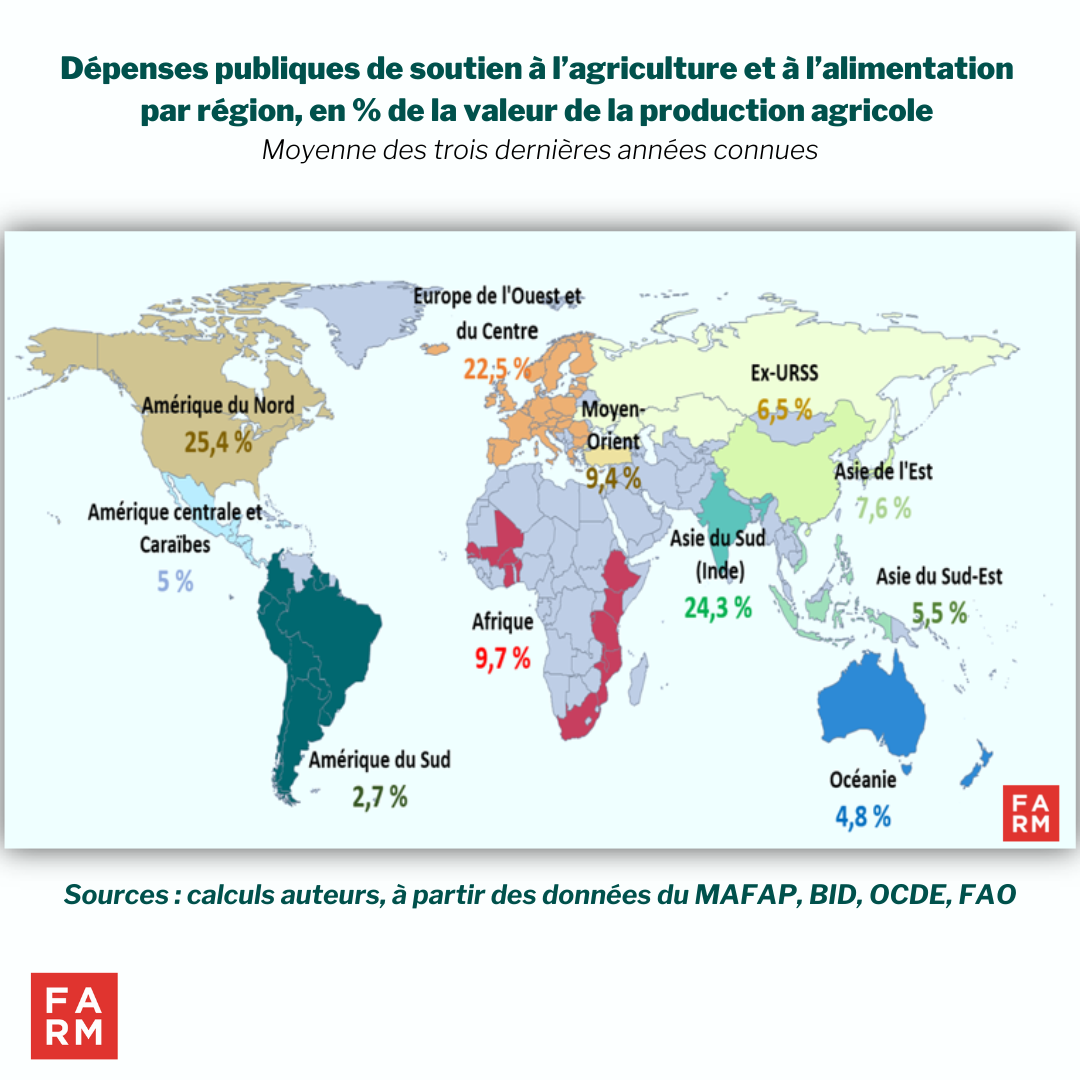
Europe and North America, which are the two leading exporting regions of raw and processed agricultural products, are also those that spend the most on their agriculture and food.As shown in Map 1, this represents between 22 and 25 % of the value of agricultural production, a particularly high figure compared to other countries and regions, with the exception of India (24 %).
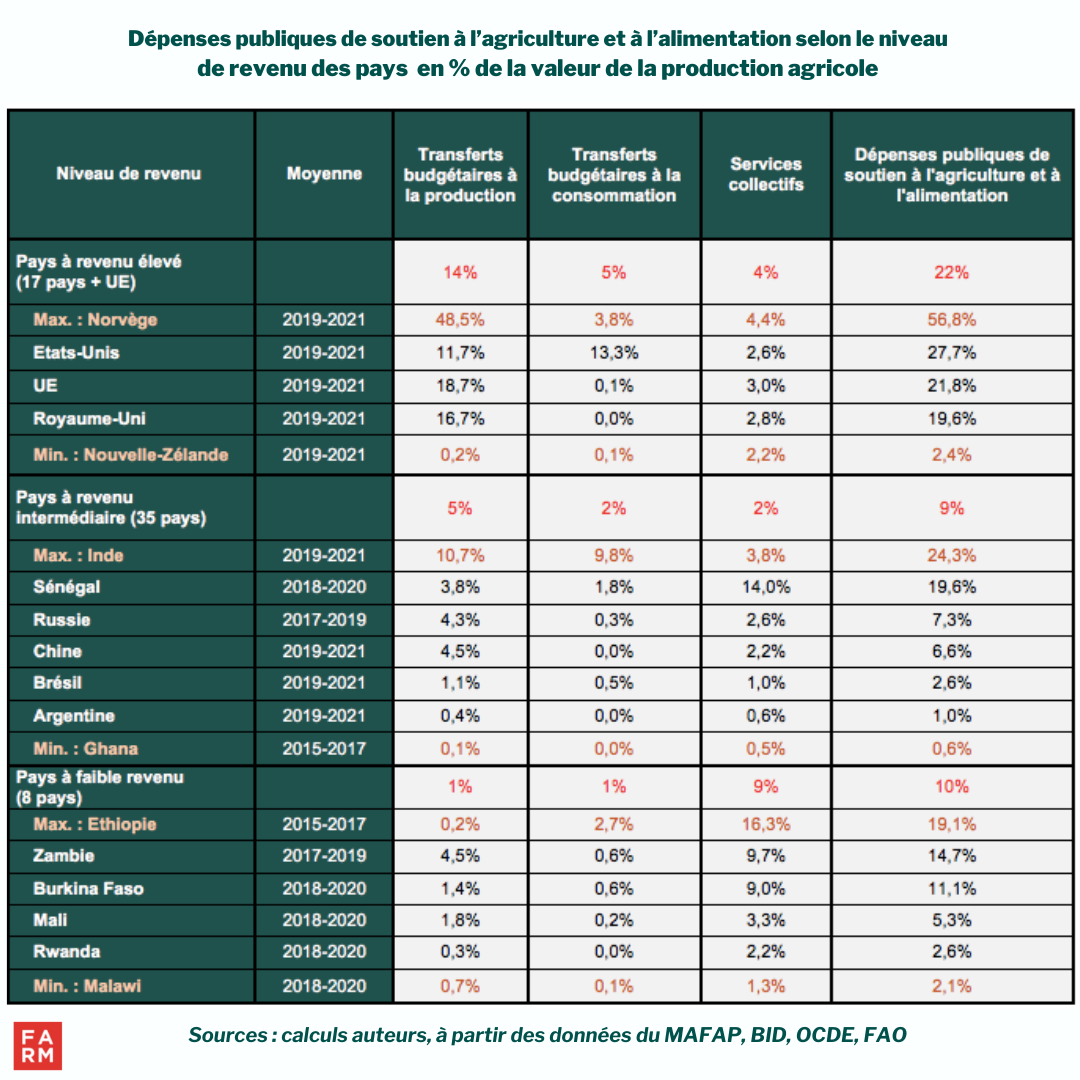
However, there are significant variations within each category of countries. These gaps are mainly due to differences in the amount of budgetary transfers to producers. These represent the bulk of support spending in high- and middle-income countries. In contrast, in low-income countries, where producers often play a key role in the economy and employment, they receive much less support. Fiscal transfers to producers are 14 times larger in high-income countries than in low-income countriesSub-Saharan Africa lags far behind, with producer support averaging less than 1% of the value of agricultural production. In Ethiopia, for example, budgetary transfers to producers are almost 100 times lower than in the EU (as a percentage of the value of agricultural production).
The FARM Observatory also analyzes budgetary transfers to consumers, which notably take the form of subsidies. High-income countries are those that support food consumption the most (5 % of the value of agricultural production). These transfers are particularly high in North America where they represent 12 % of the value of agricultural production. India is also among the countries that most support food consumptionDespite the food insecurity that remains prevalent in sub-Saharan Africa, transfers to consumers from the state budget are less than 1% of the value of agricultural production.
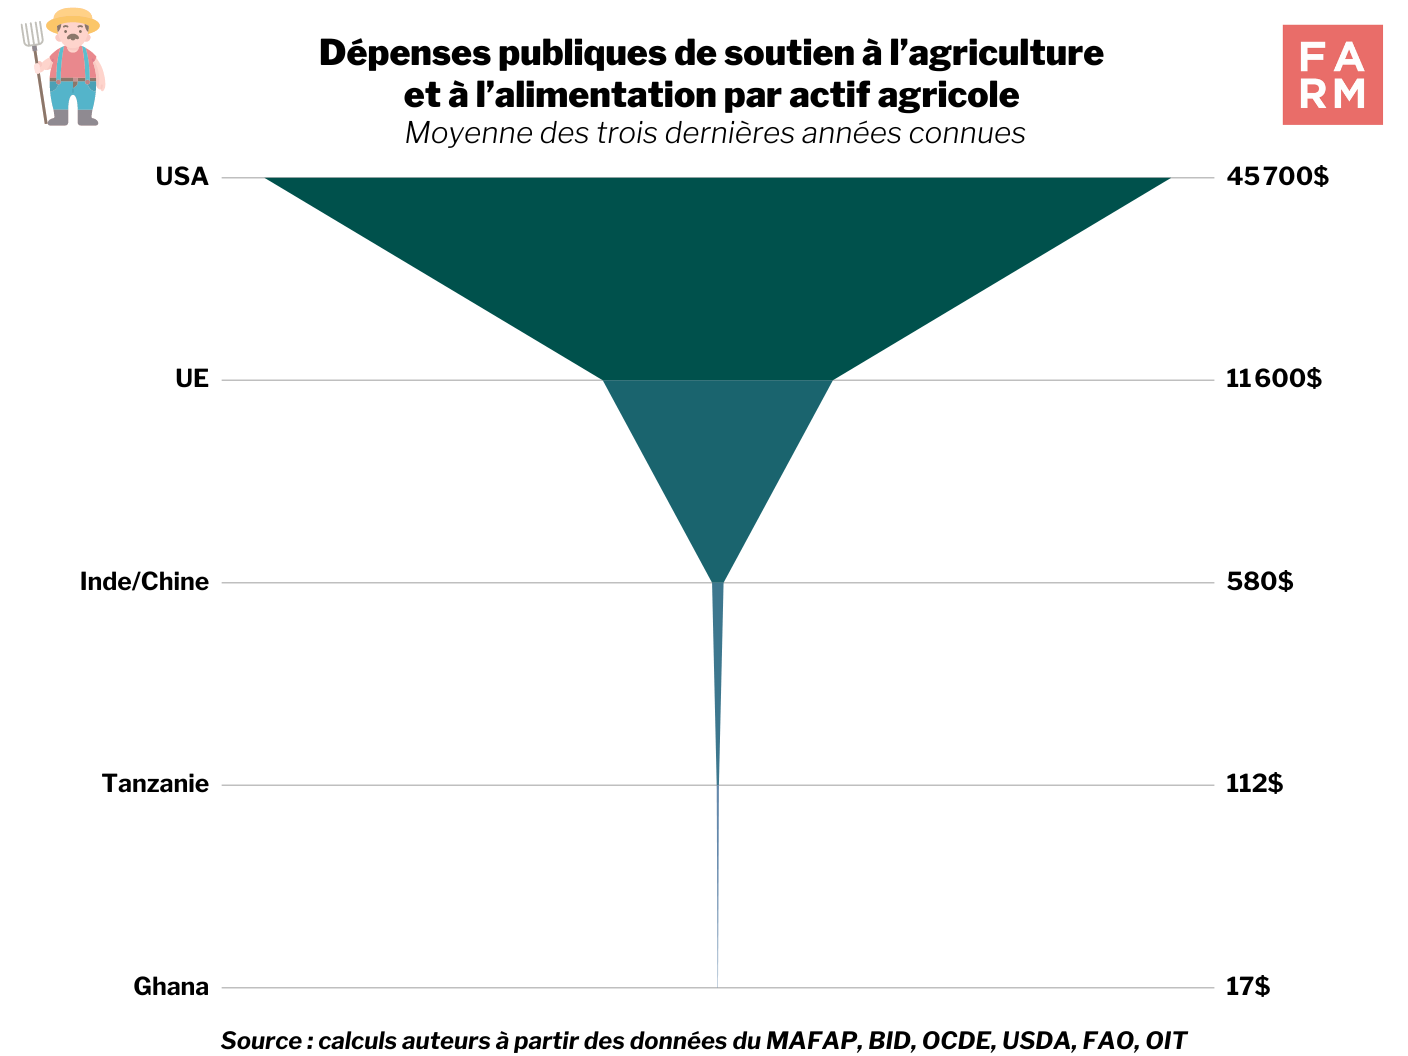
The gap in support between rich countries, emerging countries and low-income countries increases considerably when the amounts are related to the number of family workers or employees working in agriculture. Thus, Public spending on agriculture and food support per agricultural worker in the United States is 80 times higher than in India or China and 2,690 times higher than in Ghana.
Sub-Saharan Africa: agriculture indirectly supported
Of the 15 countries analyzed in the FARM Observatory, 10 have reached the funding target decided by African states in Maputo. In 2003 in Mozambique, the latter committed themselves through the Detailed Africa Agriculture Development Programme (CAADP) to dedicate at least 10,% of public budgets to the agricultural sector in order to give it new impetus and thus stimulate its growth to 6,% per year. This threshold of 10,% has since become the performance criterion par excellence for public support for African agriculture. However, these good results are attributable to a too large a portion of rural spending that does not directly support the sector. When only expenditure specific to agricultural activity is considered, the average level of this support is reduced by more than half, from 12 % to 5 % of the total public budget. In this case, Ethiopia becomes the only country to respect its Maputo commitment.
As in all low-income countries, Most public support for agriculture and food in sub-Saharan Africa is overwhelmingly directed towards collective services for agriculture and food. These services represent more than 80 % of total agricultural budget expenditure but two-thirds do not directly target the agricultural sector. These include, for example, rural expenditure on health, education, infrastructure, etc. However, these expenditures are essential and contribute, indirectly, to the development of the agricultural sector since the majority of rural populations work in this sector. The remaining third, directly directed towards the agricultural sector, is made up of expenditure on training (2% of collective services), extension (2 %) or agricultural infrastructure (11 %).
There The share devoted to research (3 %) remains well below the target of 1 % of the agricultural gross domestic product set by the Malabo agreements (0.29 % today). However, IFPRI argued in its Global Food Policy Report (2020) that an increase in agricultural R&D in sub-Saharan Africa, amounting to 1% of agricultural GDP, could increase productivity by 60% by 2050.
The weight of input subsidies
Unlike in high-income countries where a large part of support takes the form of budgetary transfers to producers, in Africa, these expenditures remain very low (see Table 1). They are also allocated to more than 90 % to subsidies for the purchase of inputs, to the detriment of other actions that could benefit producers just as much, if not more, such as production subsidies, income supports, etc. In view of the levels of agricultural productivity in the region, this observation raises many questions about the effectiveness of these input subsidies (mainly fertilizers) and the justification for their weight in production aid.
Budgetary transfers for consumption are, for their part, mainly composed of aid to consumers (98 %). Only 1 % of consumer support is devoted to processors, who are nevertheless essential to the development of agrifood sectors..
Budgets dependent on external aid and rarely disbursed (in full)
While public support directly for agriculture and food remains low and concentrated on certain measures, it is also important to remember that agricultural budgets are highly dependent on external aid. In Rwanda, for example, more than half of agricultural budgets come from donor support. This rate exceeds 30% in several countries, such as Burkina Faso, Malawi, Mali, and Senegal, according to MAFAP data. Finally, it is important to note the existence of differences in the level of budget execution from one country to another. Gaps are observed between forecast and actual disbursed budgets in Uganda, Zambia, and Ghana.
So, although there are big differences from one country to another, it is clear that overall the higher the income of a country, the more it spends to support its agriculture (as a proportion of the value of agricultural production). Finally, a figure to remember: expenditure on support for agriculture and food in sub-Saharan Africa is half that of Europe and North America.
Behind these gaps in support, one question remains pressing: Can agricultural policies, particularly in sub-Saharan Africa, contribute to the emergence of sustainable agricultural and food systems, and more generally to the achievement of SDGs by 2030 ? This first analysis of public spending to support agriculture and food shows that it is currently insufficient to support the dynamics of transformation underway.
The authors thank Jean-Christophe Debar for his involvement in this project.
4 commentaires sur “Plus les pays dépendent de l’agriculture, moins ils la soutiennent”
Leave a Reply
You must be logged in to post a comment.
Good morning,
I read with great interest the creation of this observatory as a tool for analyzing the interventions of world governments in agriculture. This complements the work of RESAKSS, which deals solely with Africa. However, I note that public spending on agriculture and food is 9.7% in Africa, while RESAKSS shows less than 3% (see: https://www.resakss.org/node/3), with details by country. Why this difference?
In the methodological note presenting the Observatory, only 17 high-income countries were cited out of the 44 announced. Is this because of the EU 27? 37 middle-income countries were cited instead of the 35 announced. Why?
Beyond all that, the methodological note provided me with some very interesting information regarding support to agriculture. Total support to agriculture and food = STAA = DPAA + SPM. That's interesting.
Furthermore, in what cases can government measures that make the Market Price Differential (MPD) negative be beneficial for a country? I can't understand.
Congratulations to you for this commendable initiative.
THANKS.
Good morning,
Thank you for your comment and your remark about the number of countries.
Indeed, you were right: that's 44 high-income countries (HICs), including the 27 countries of the European Union.
At the middle-income country (MIC) level, a last-minute addition of Zimbabwe was not included in the total and a miscount of Panama (high-income country). In summary, the total of 88 countries is broken down into:
– 44 PRE
– 36 PRI
– 8 PFR (low-income countries)
Some answers to your question about the difference with ReSAKSS:
– First, here, the 9.7 % of DPAA are expressed as a percentage of the value of agricultural production, whereas at the ReSAKSS level they are as a percentage of total government expenditure.
– Second, the average here covers 16 sub-Saharan African countries, whereas the ReSAKSS Africa average covers a larger number of countries.
– Third, we used MAFAP data and they cover 15 out of 16 countries (South Africa being by the OECD). Even though the MAFAP and ReSAKSS agricultural expenditure measures are comparable, they are calculated with different methodologies and objectives (see for example Annex 1 of this document on page 44: https://www.fao.org/fileadmin/templates/mafap/documents/Methodological_Guidelines/Methodological_Guidelines_-_Volume_II_-_Public_Expenditure_-_Final.pdf ).
Similarly, Table A3 (FIGURE 7) on page 89 of the 2021 MAFAP report (Public expenditure on food and agriculture in sub-Saharan Africa: trends, challenges and priorities) gives the sources of differences with ReSAKSS for certain countries (Ethiopia, Burkina Faso, Senegal, etc.)
Finally, on the last question concerning negative DPM, two examples which may perhaps enlighten you:
– First of all, the primary beneficiary of negative DPMs is the consumer, who benefits from the reduced prices of the agricultural product in question. In this sense, it can be implemented by a State to ensure affordable prices for consumers and therefore for food security purposes.
– Second case, for large agricultural exporting countries, for example Argentina on soybeans, export taxes constitute a significant source of tax revenue for the State.
Spoiler Alert!!!!
The next blog will address these issues more specifically.
I hope I have answered all your questions.
THANKS
Thank you for this great article!
You write, "Thus, public spending on agriculture and food support per agricultural worker in the United States is 80 times higher than in India and 2,690 times higher than in Ghana." But then the graph is for China, not India. Isn't that a mistake?
Hello, and thank you for your comment! To answer your question, public support spending per agricultural worker in China and India is exactly the same. We have just clarified this in the graph. Best regards, The FARM Foundation