Africa conquering global markets? Dynamics and changes in agricultural and food exports
The US administration's announcements of tariff increases in early April 2025 have raised considerable concern for agricultural and food exporting countries, particularly those in the Global South. In response to these announcements, the FARM Foundation has published a comprehensive overview of sub-Saharan African trade. especially with the United StatesThis overview calls for a more in-depth examination of the continent's trade structure and dynamics and opens a series of continental and sub-regional data and infographic publications. Let's take a closer look at these developments at the continental level with graphs.
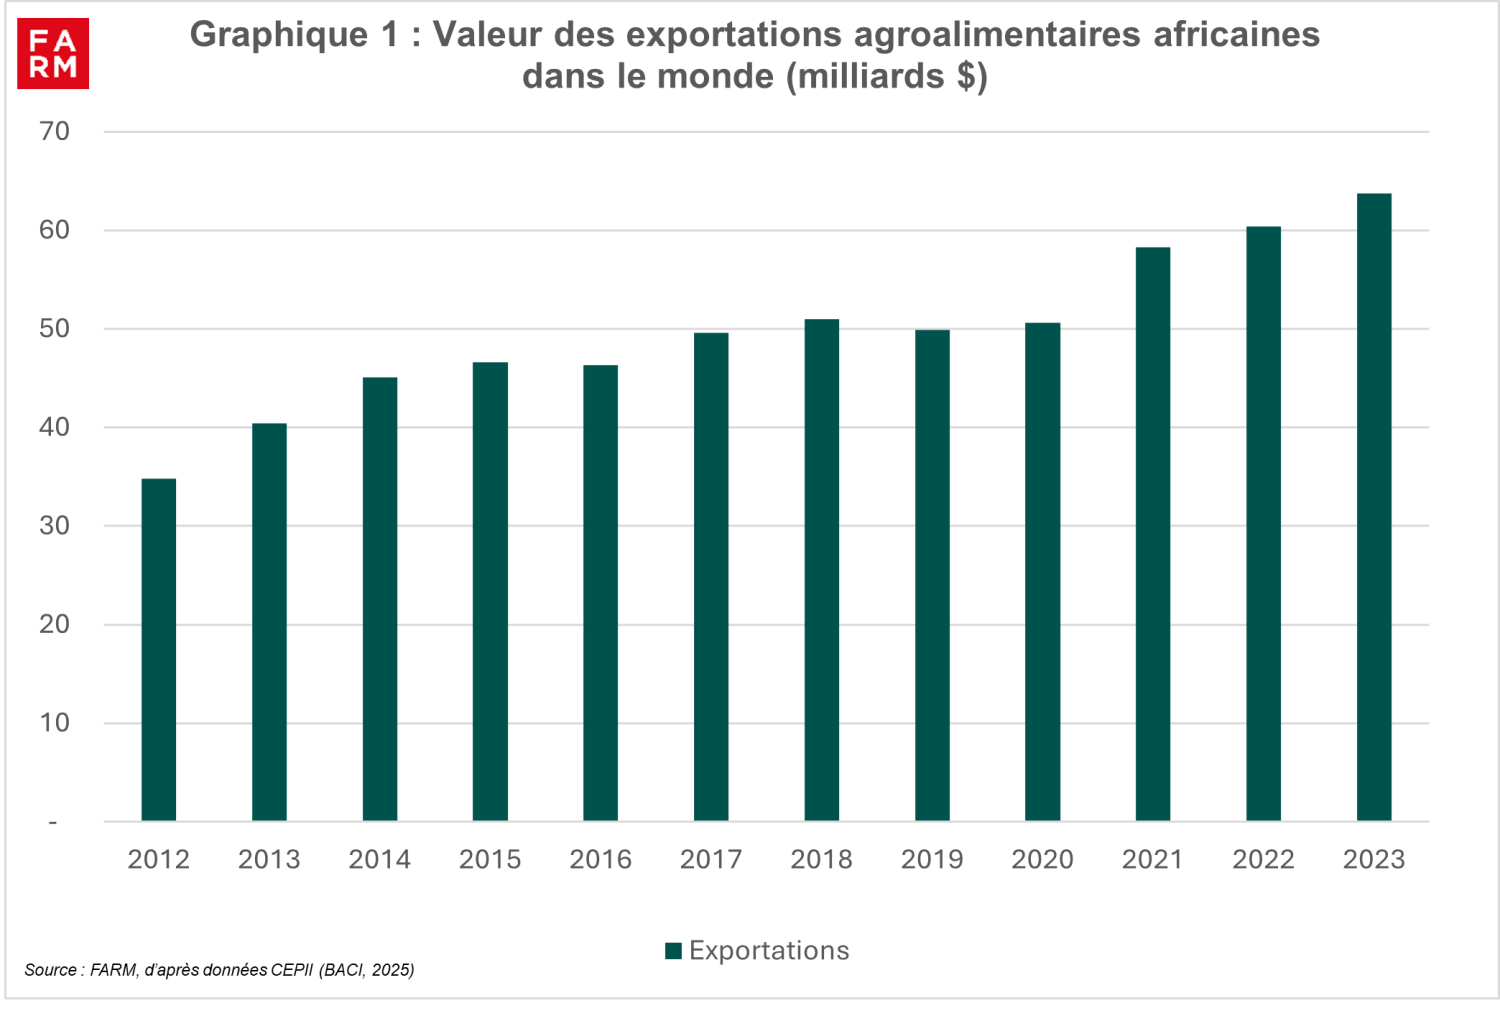
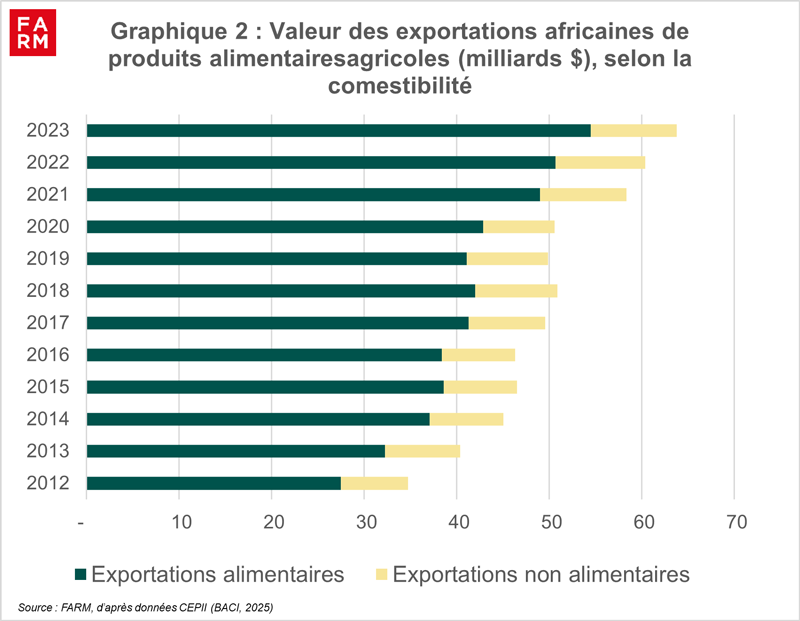
85 % increase in the value of agri-food exports in a decade
There is an overall growth in African agricultural exports, rising from around USD 35 billion in 2012 to nearly USD 65 billion in 2023.
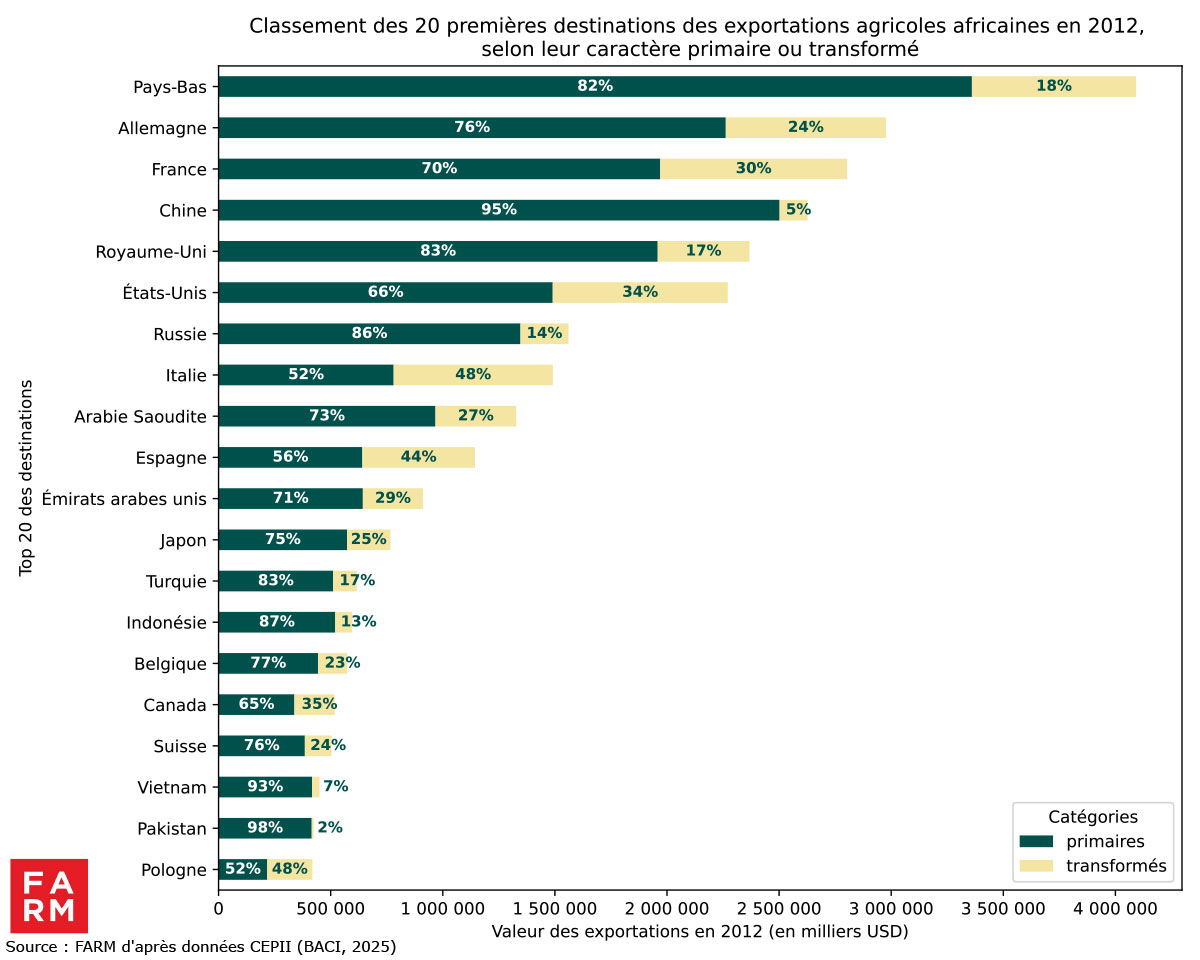
African agricultural exports still largely concentrated on raw or minimally processed food products
![]()
While the value of agricultural and food exports has experienced sustained growth, the distinction between raw and processed products remains very marked. In 2023, primary products accounted for nearly two-thirds of African exports to the rest of the world. The majority of exports outside the continent remain dominated by raw materials or minimally processed products. However, the growth of agri-food industries in countries such as Morocco, Tunisia, and South Africa demonstrates a gradual rise in the range of African exports. It is also important to note that in intra-African trade, the share of processed and semi-processed products increased from 63 % to 72 % between 2003-2005 and 2018-2020, according to a RESAKSS study, reflecting the dynamism of the local agro-industrial sector, particularly in West Africa.
Flows directed mainly towards Europe and Asia
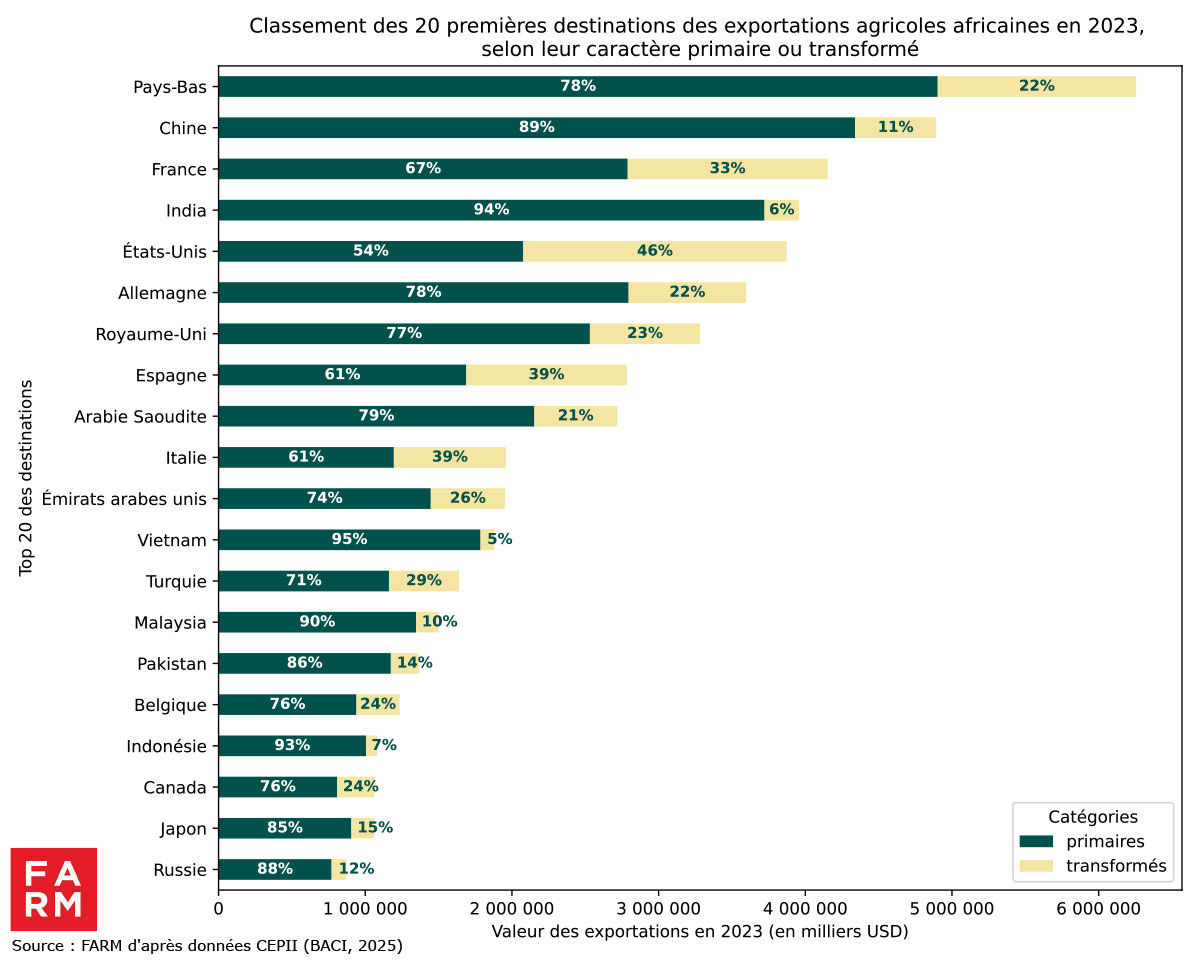
The evolution of African agricultural export destinations has been characterized by marked diversification since the 2000s. While Europe has long been the main outlet, we are now seeing a rise in the importance of Asian countries, with the two blocs constituting the two major destinations, with raw products representing the majority of exports. As the graphs indicate, there is a growing openness towards emerging Asian markets such as China, India, Vietnam, and Malaysia, as well as Gulf countries. Although this analysis focuses exclusively on African agricultural exports to extracontinental markets, it is worth highlighting, as indicated in the 2020 Africa Agriculture Trade Monitor (2020 AATM) report, a growing dynamic of intra-African trade, particularly within regional blocs such as the Southern African Development Community (SADC) or the Common Market for Eastern and Southern Africa (COMESA).
Chart 4: Main export destinations, by product edibility over the periods 2012 and 2023
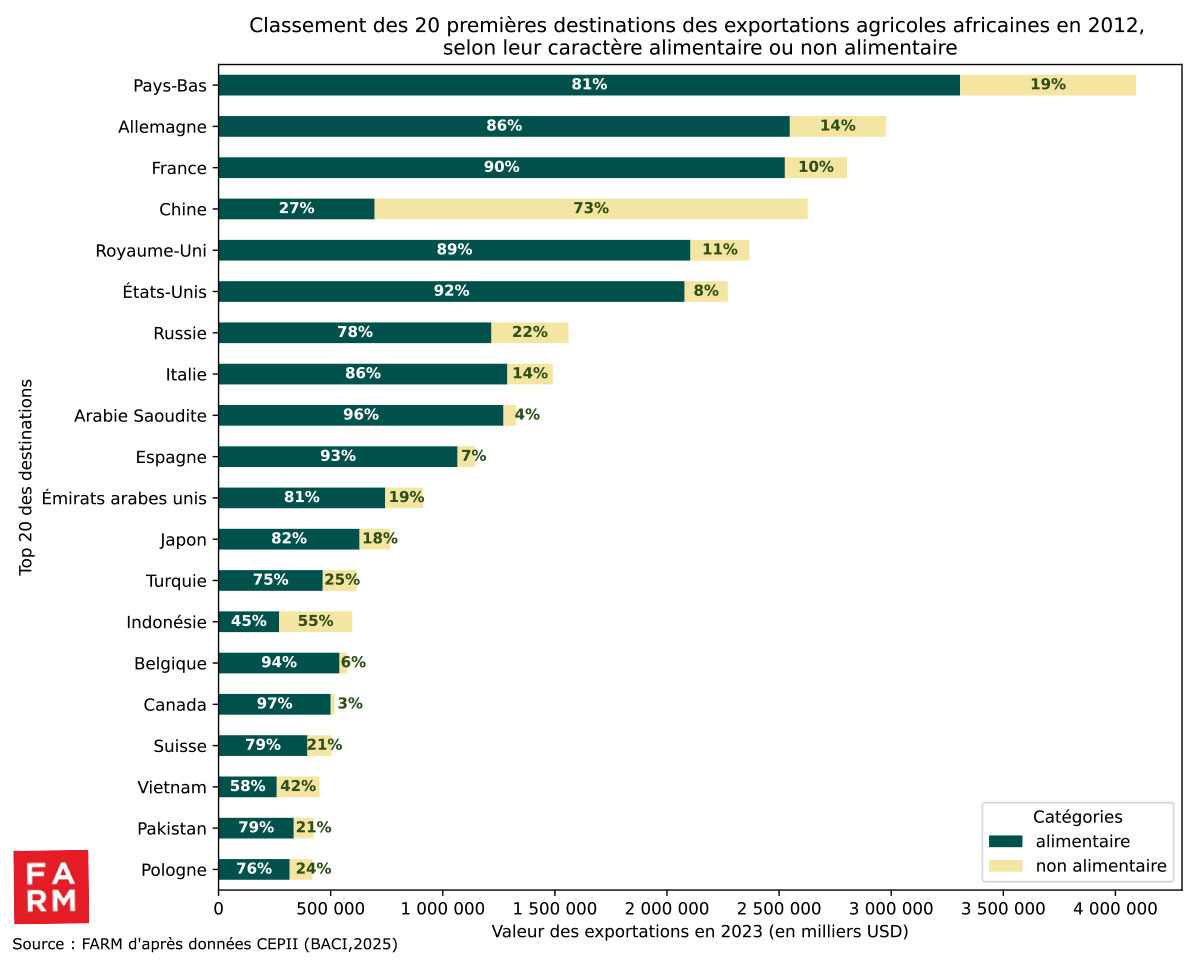
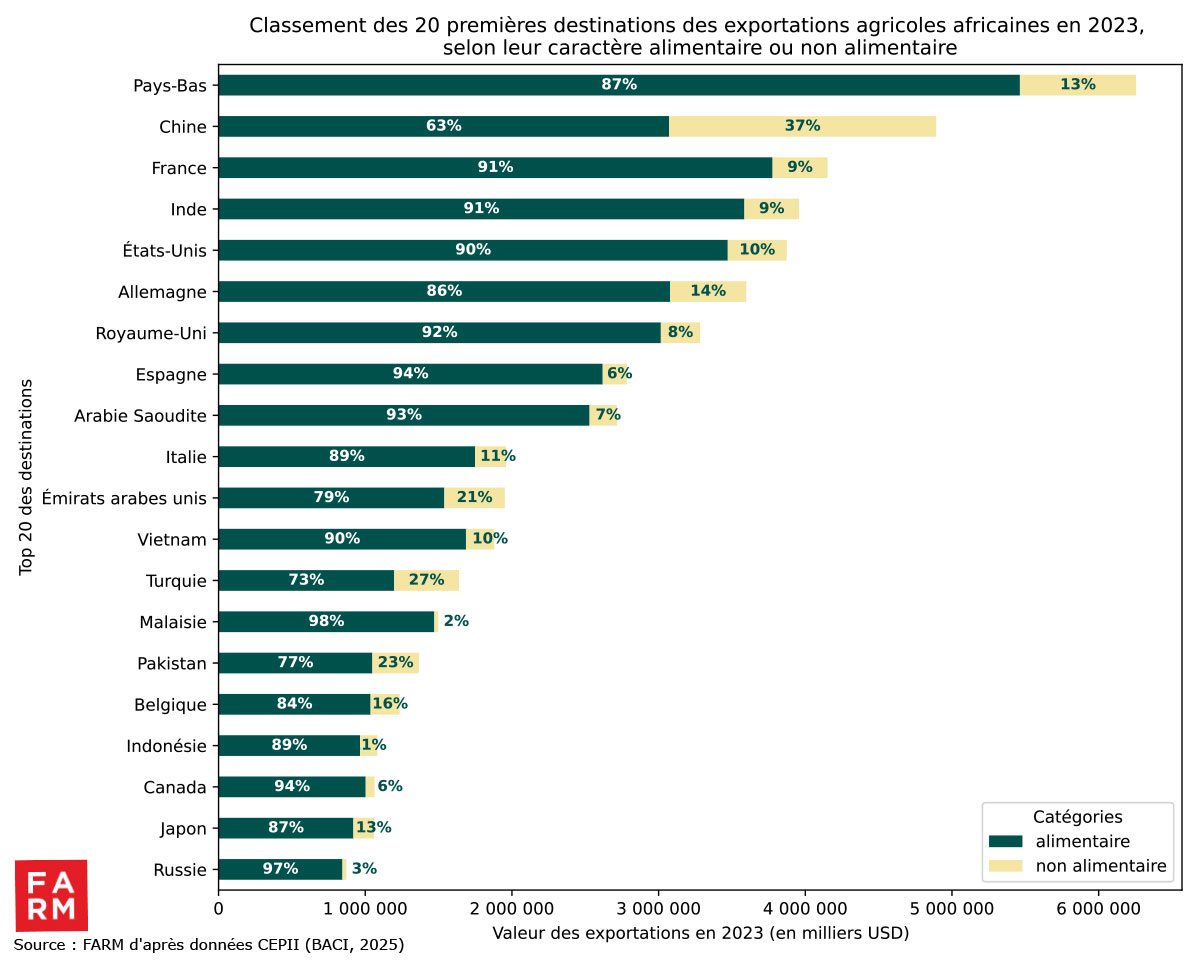
Chart 5: Main export destinations, by level of product processing over the periods 2012 and 2023
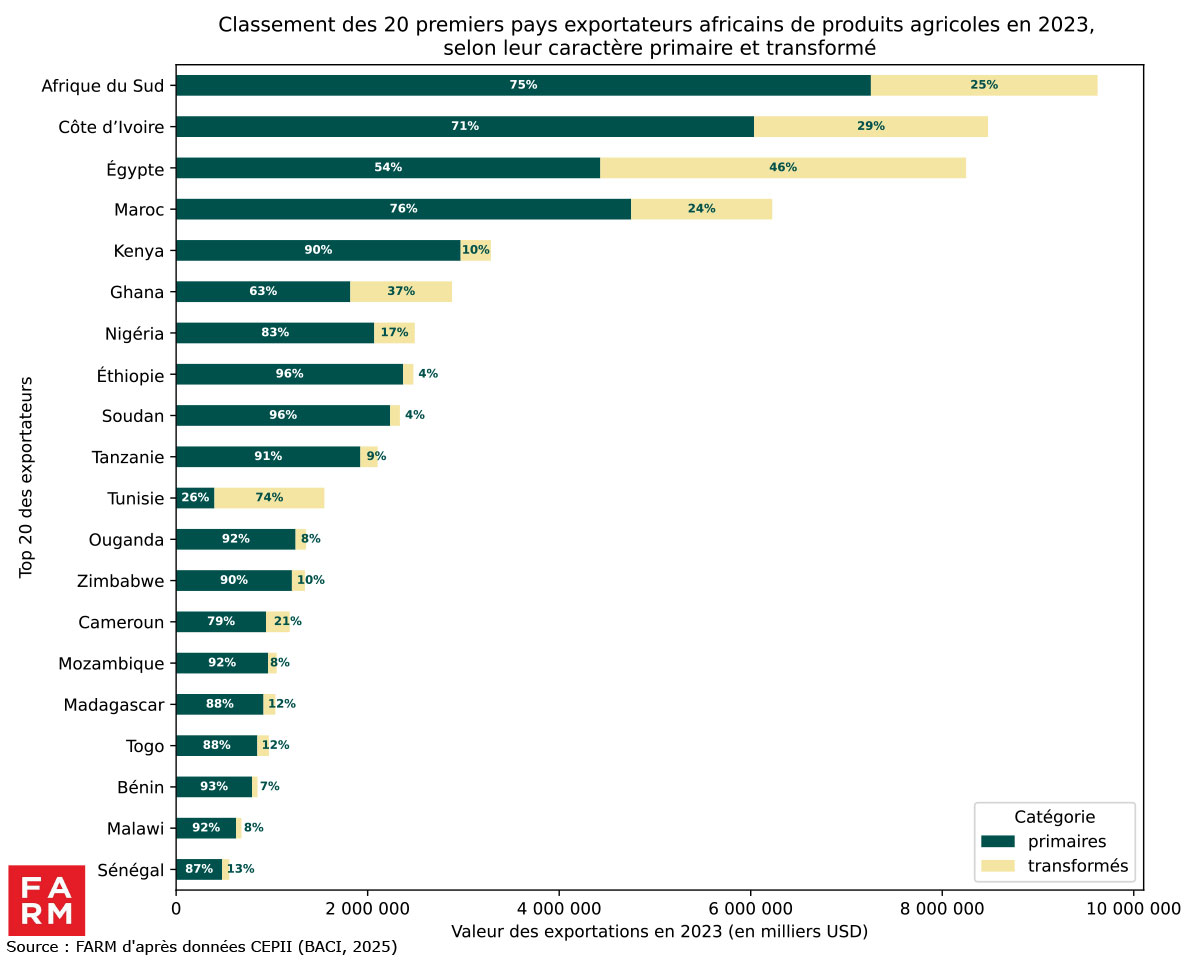
South Africa, Ivory Coast, Egypt, Morocco and Kenya: African export champions
South Africa, Ivory Coast, Egypt, Morocco, and Kenya remain the undisputed leaders in African agricultural exports over the period studied (2012-2023). These countries have demonstrated remarkable performance.
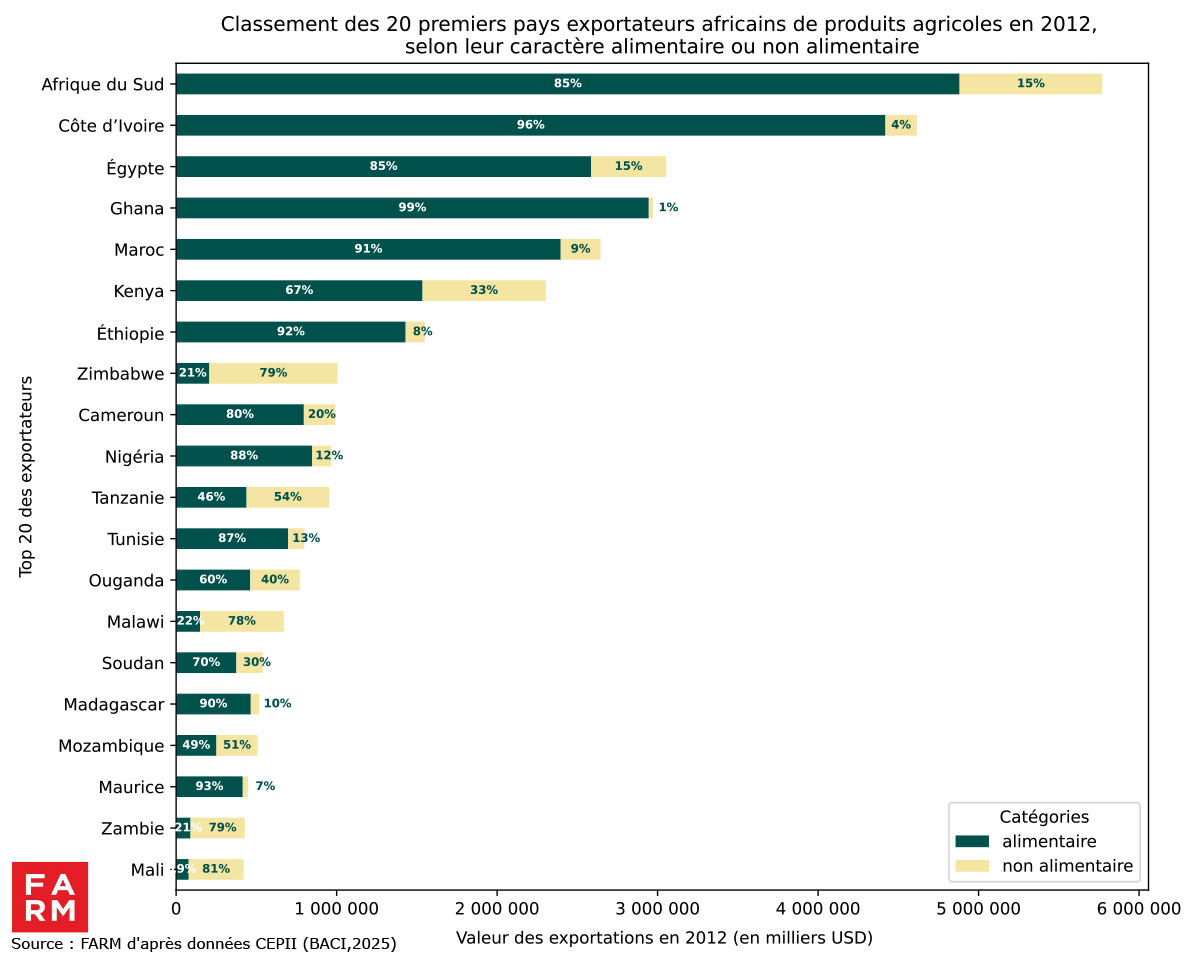
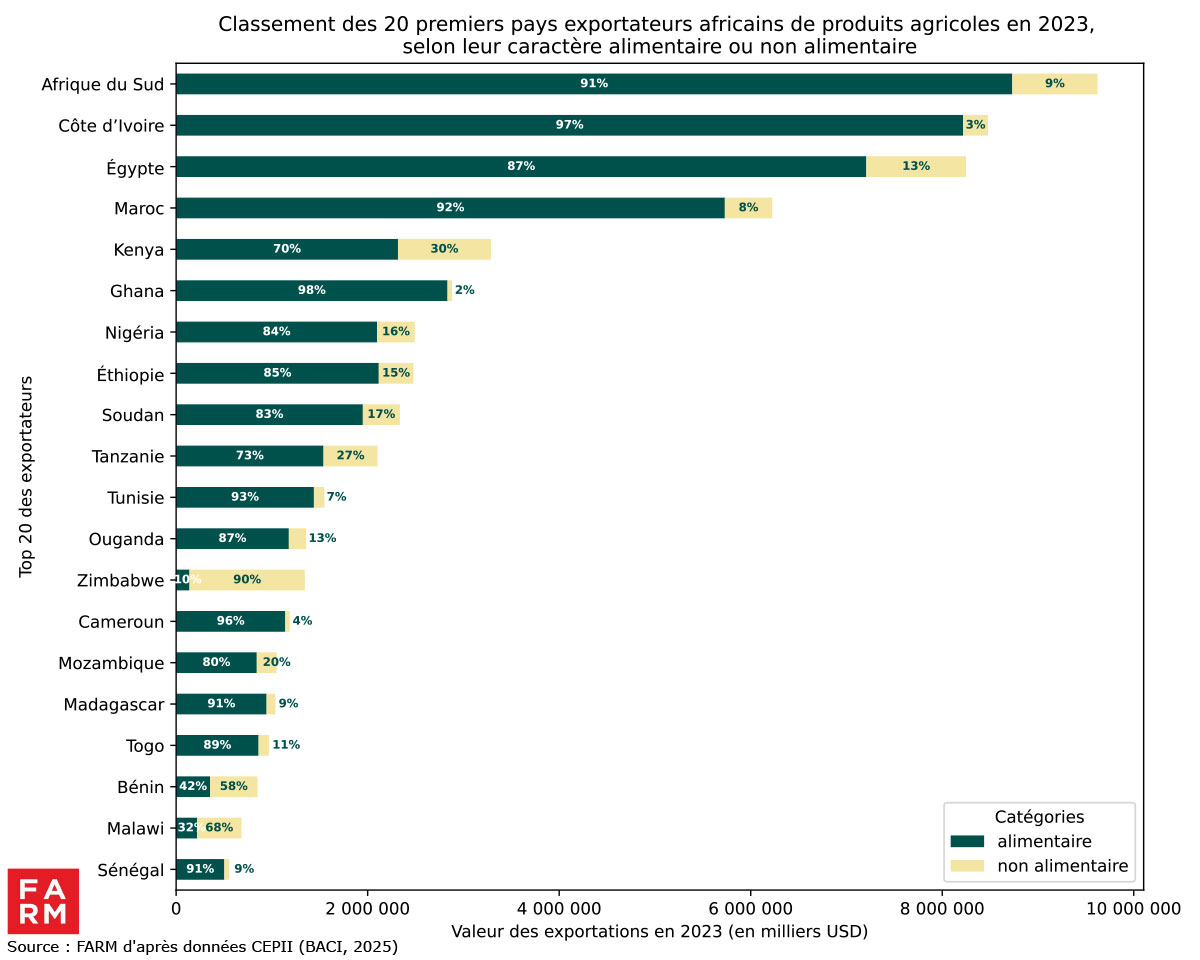
According to the edibility of products (Figure 6), South Africa maintains the first place in agricultural exports on the continent with a notable increase in the proportion of food products compared to non-food products exported (from 85 % in 2012 to 91 % in 2023). Côte d'Ivoire, Egypt and Morocco also maintain a strong specialization in food products, with stability in the food shares of their respective exports as shown in the figure.
Kenya, unlike other leading countries, maintains a significant share of non-food products (around 30 %), indicating a specific diversification in segments such as cut flowers or ornamental plants.
Chart 6: Main African exporters, by product edibility over the periods 2012 and 2023
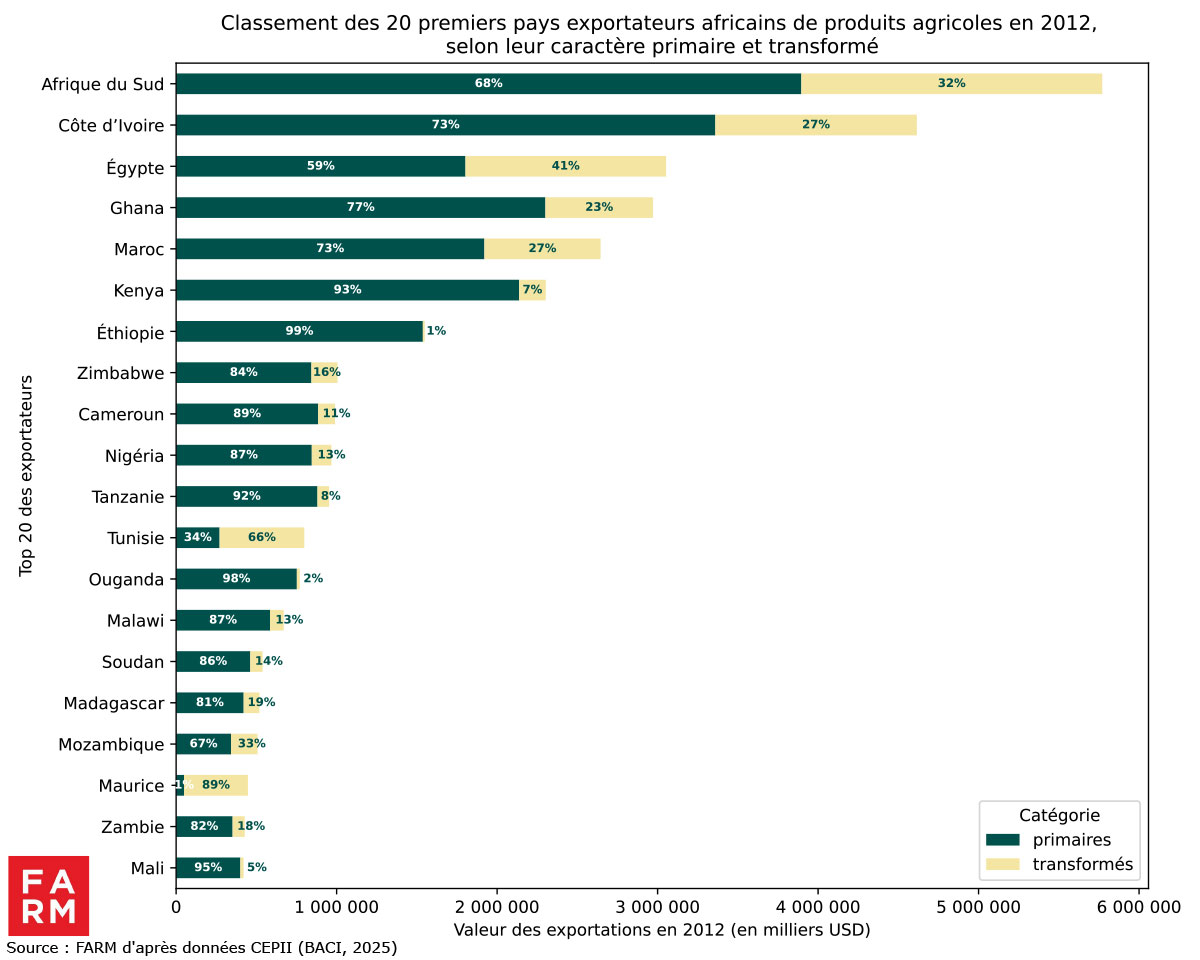
Depending on the degree of processing of products (see Figure 7), a notable increase in the share of processed products is observed in several countries. This trend is particularly marked in Egypt, where the proportion of processed products increased from 41 % to 46 %, and in Ghana, from 23 % to 37 %. These developments reflect sustained efforts to upgrade and enhance industrial value. Tunisia stands out clearly, showing a predominance of processed products (notably olive oil), whose share increased from 66 % in 2012 to 74 % in 2023. Conversely, countries such as Ethiopia and Sudan remain heavily focused on exporting primary products, with very high and stable rates, around 96 %.
Chart 7: Main African exporters, by level of product processing over the periods 2012 and 2023
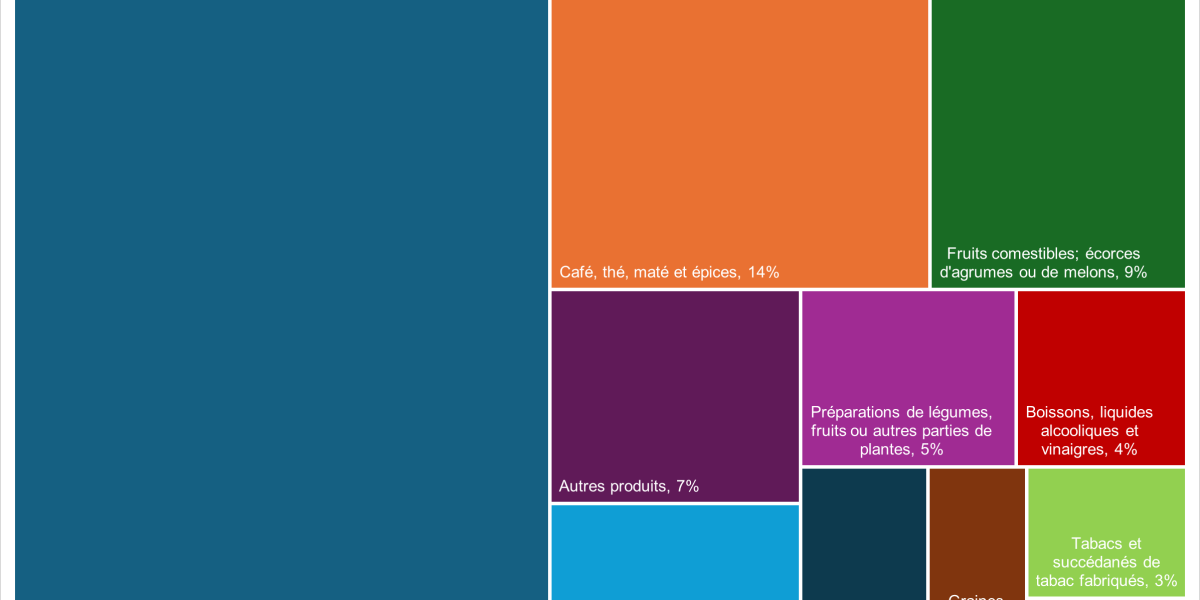
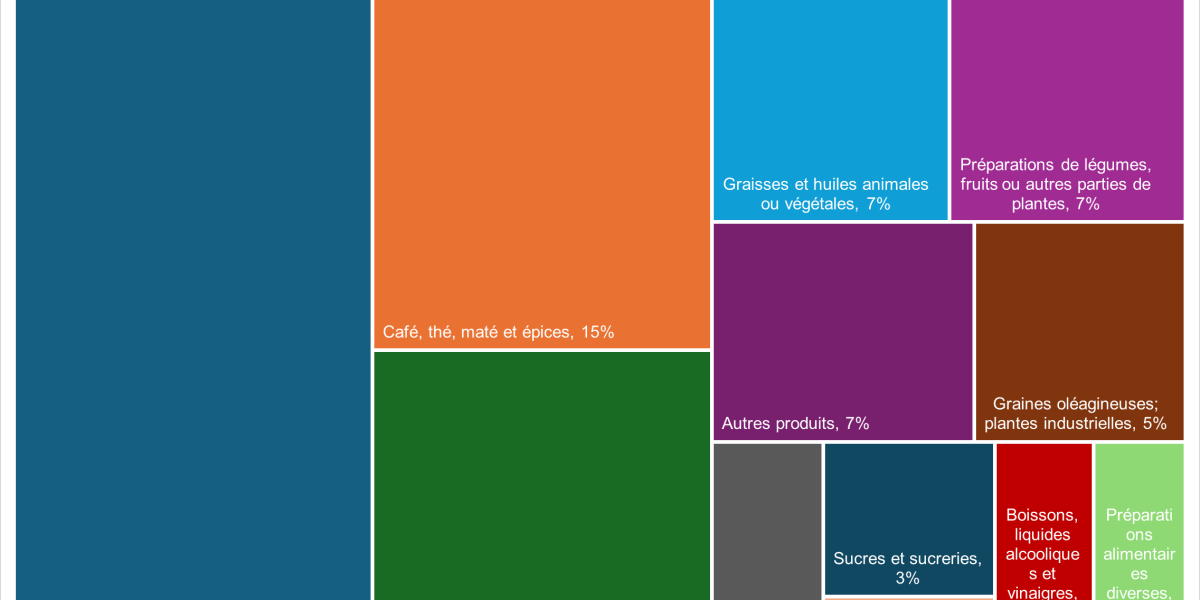
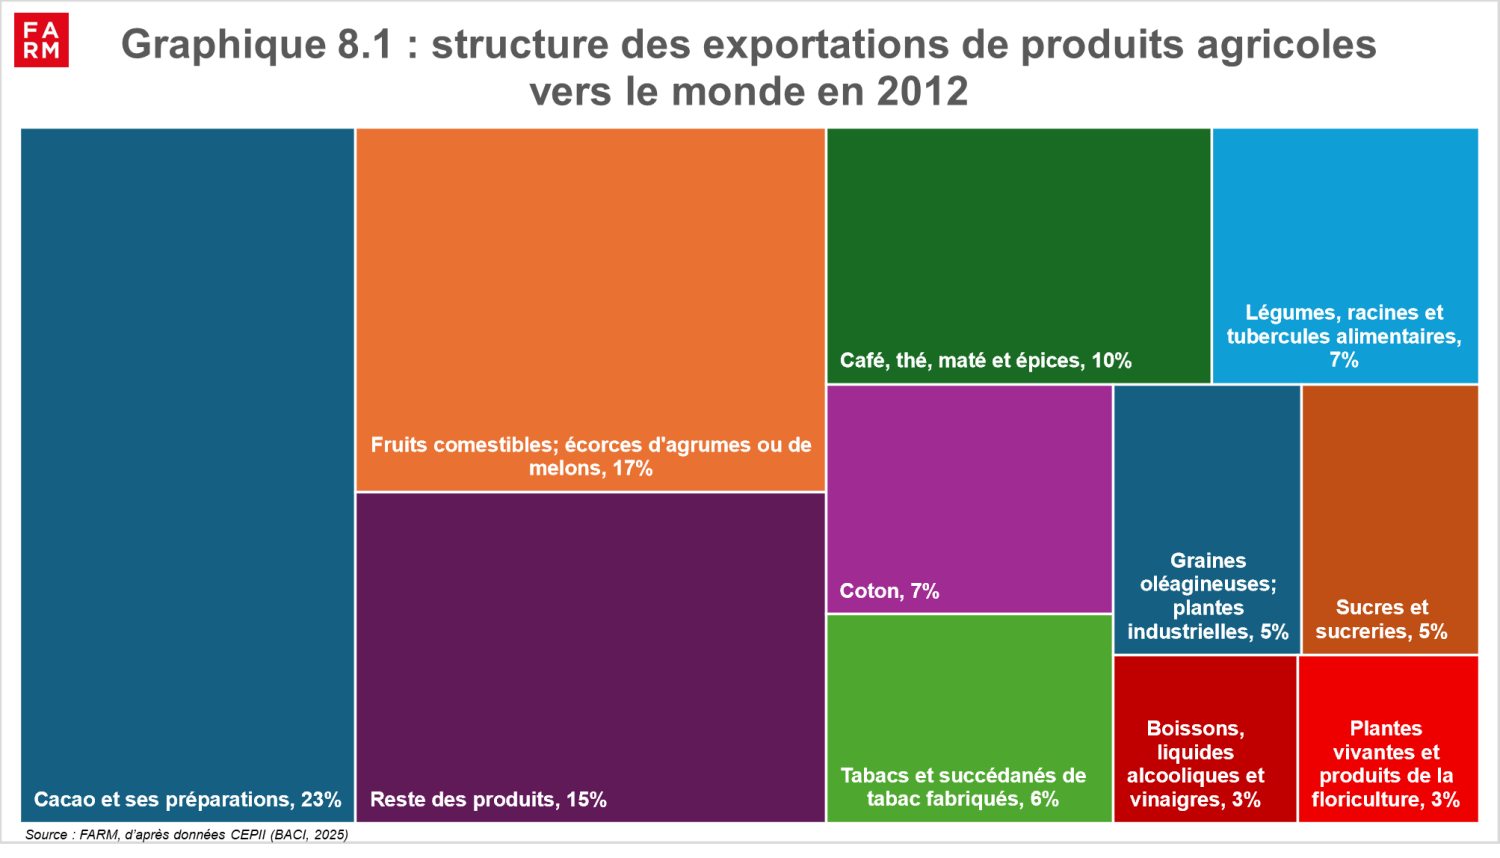
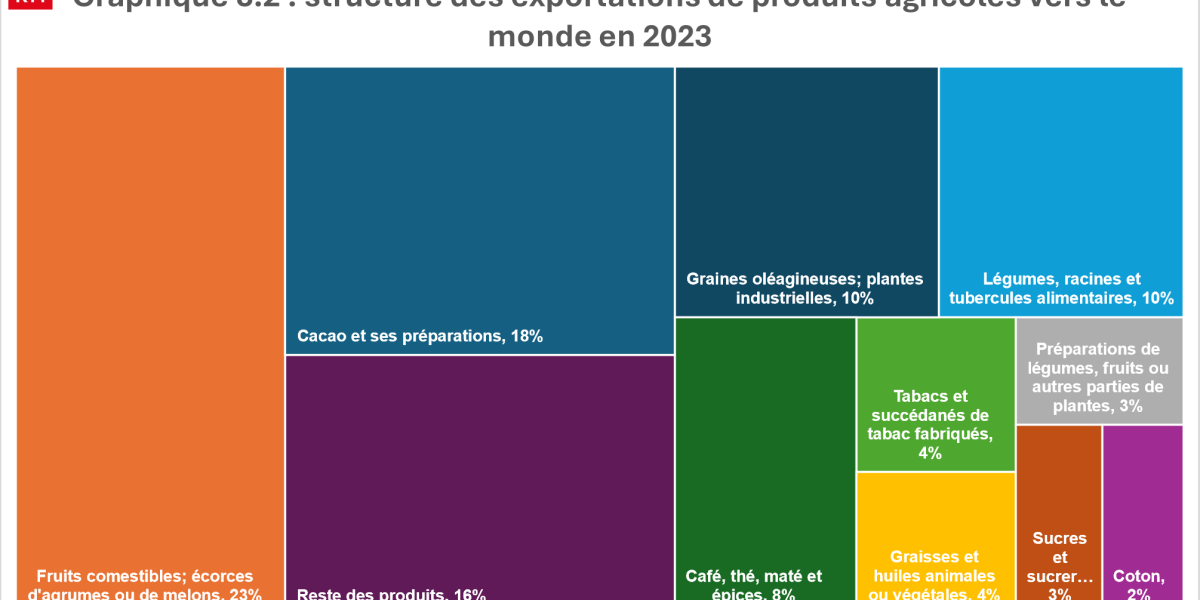
Cocoa, fruits and vegetables dominate exports
The graphs show a notable change in the composition of African agricultural exports in value between 2012 and 2023. While the flagship products remain, there are some notable changes: cocoa, although it remains central, sees its relative share decline from 23 % in 2012 to 18 % in 2023, a sign of diversification towards other products. The category of edible fruits, citrus peel and melons is growing strongly, going from 17 % to 23 % and thus becoming the leading export group.
There has also been significant growth in certain sectors, particularly oilseeds and industrial plants, whose share of exports has doubled to 10.1%, reflecting the growth of these crops. Food vegetables, roots and tubers have also seen significant growth.
On the other hand, cotton, a historically major product, has suffered a sharp decline, its share falling from 7 % to 2 %, which probably reflects a loss of competitiveness or difficulties specific to the sector.
Finally, the year 2023 sees the emergence of a new category: preparations of vegetables, fruits or other parts of plants, which now represent 3 % of exports, thus highlighting the progressive development of food processing sectors.
American market: Africa intensifies and diversifies its agri-food exports
West and East Africa are the main exporting subregions to the United States. However, volumes remain modest (< USD 3 billion) and have stagnated since 2018 in these two regions. In contrast, in North Africa and Southern Africa, export values have seen a notable jump, by 37 billion and 42 billion, respectively, between 2018 and 2023. However, the US administration's tariffs could slow this momentum or divert it to other markets.
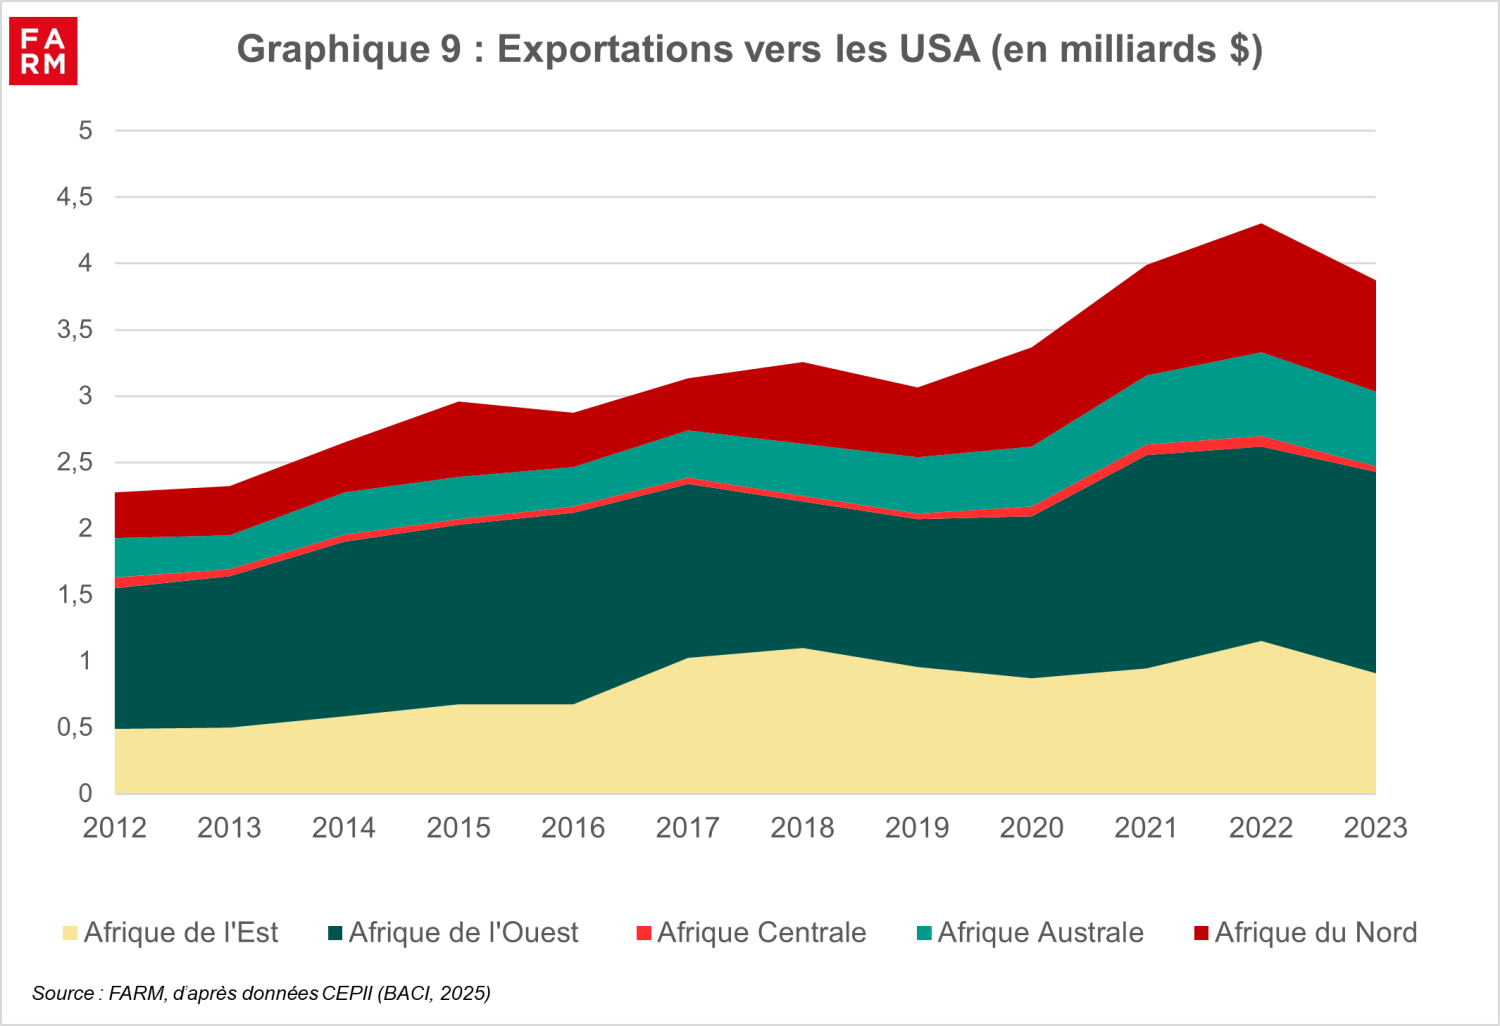
Chart 10: Structure of exports to the USA, by edibility of products over the periods 2012 and 2023
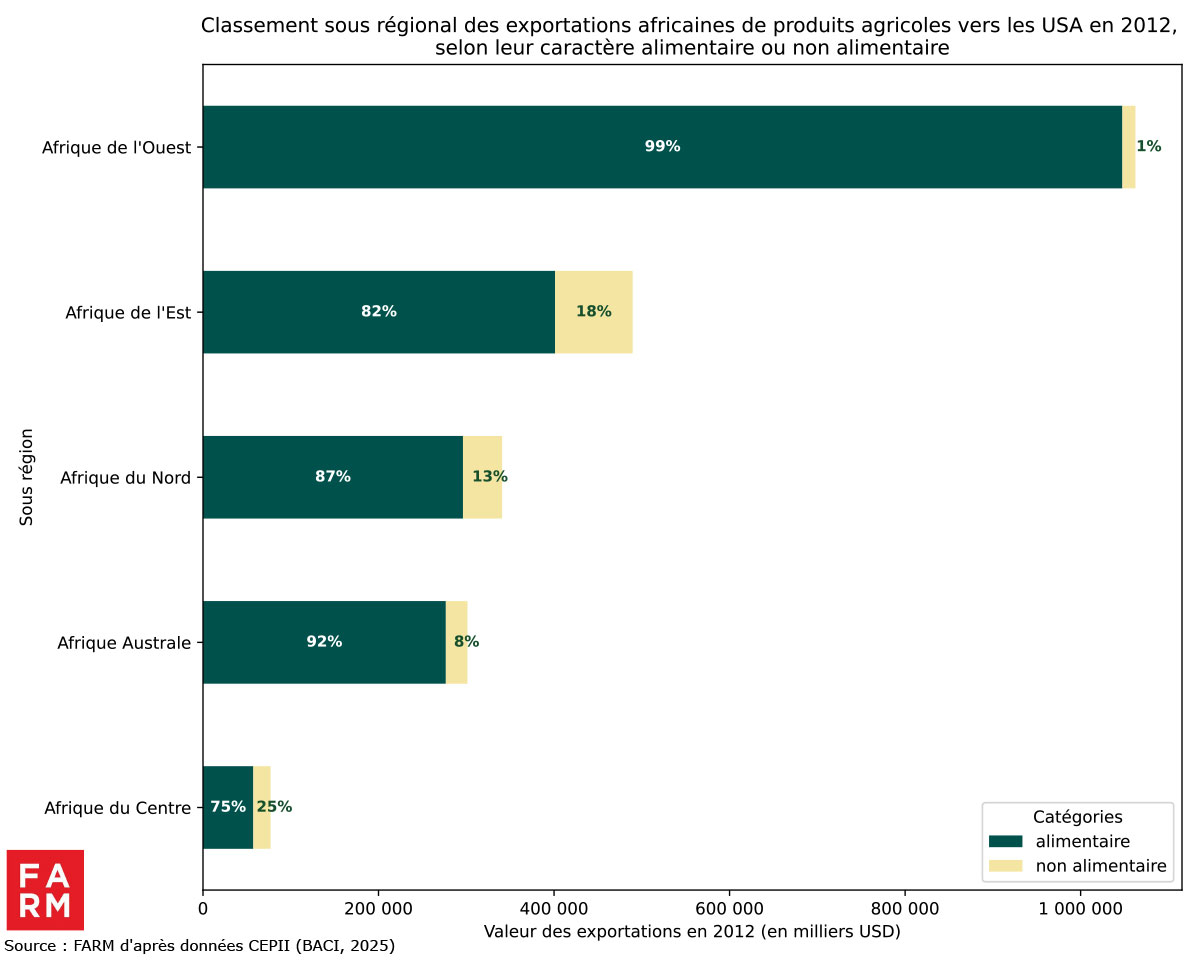
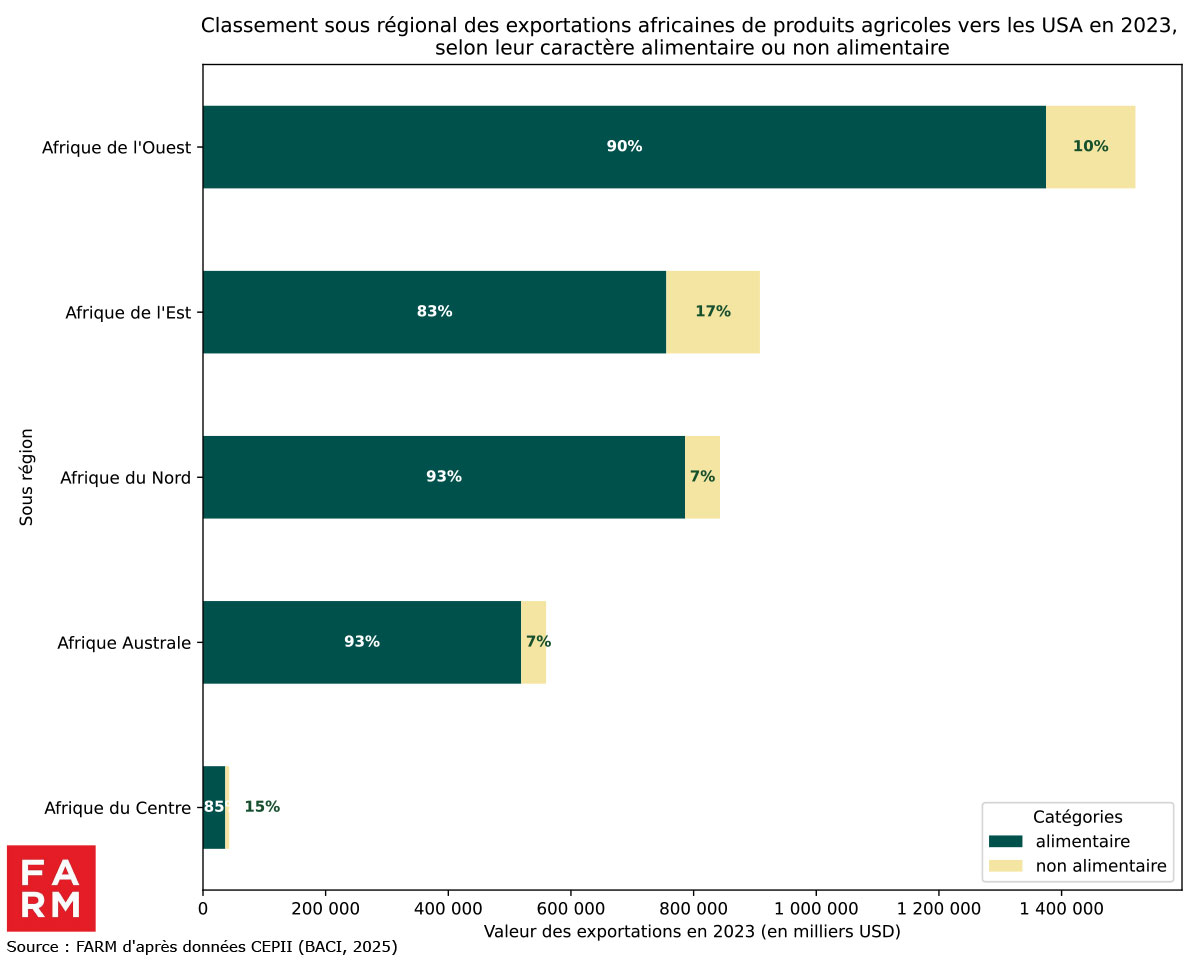
Over the past ten years, exports of processed products from the African continent to the United States have grown significantly. Thanks to the AGOA agreement, several African countries, such as Côte d'Ivoire, Ghana, Madagascar and Kenya, have increased the share of higher value-added products in their sales, such as cocoa in the form of paste or butter, chocolate, dried fruits, canned fish and vegetable oils. This dynamic reflects the efforts undertaken to diversify the exported supply and strengthen local processing, thus enabling Africa to better integrate into American agrifood value chains.
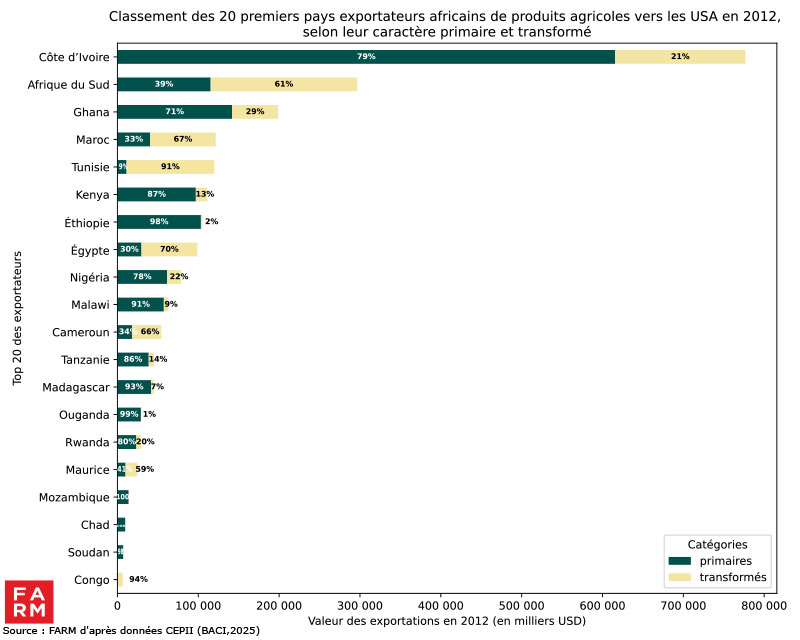
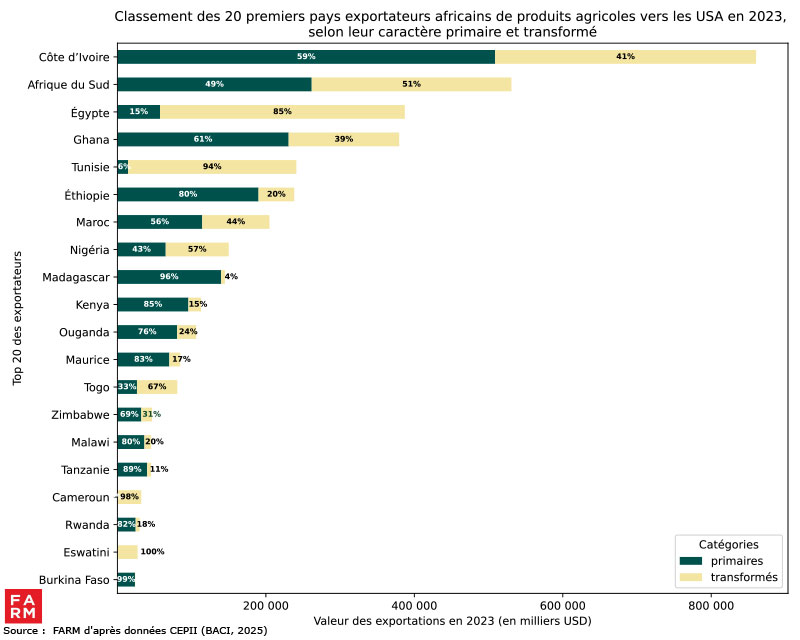
Chart 11: Structure of exports to the USA, by level of product processing over the periods 2012 and 2023
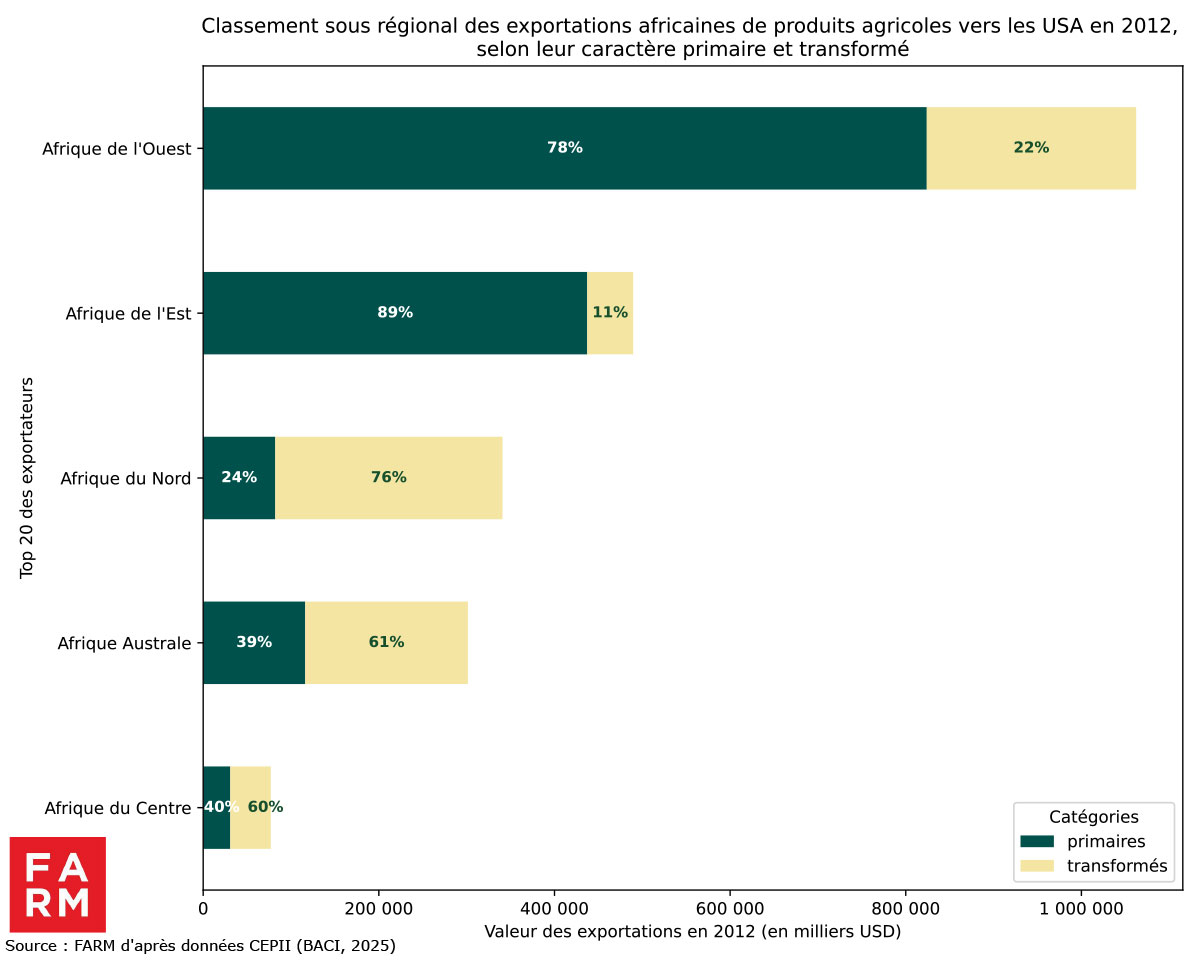
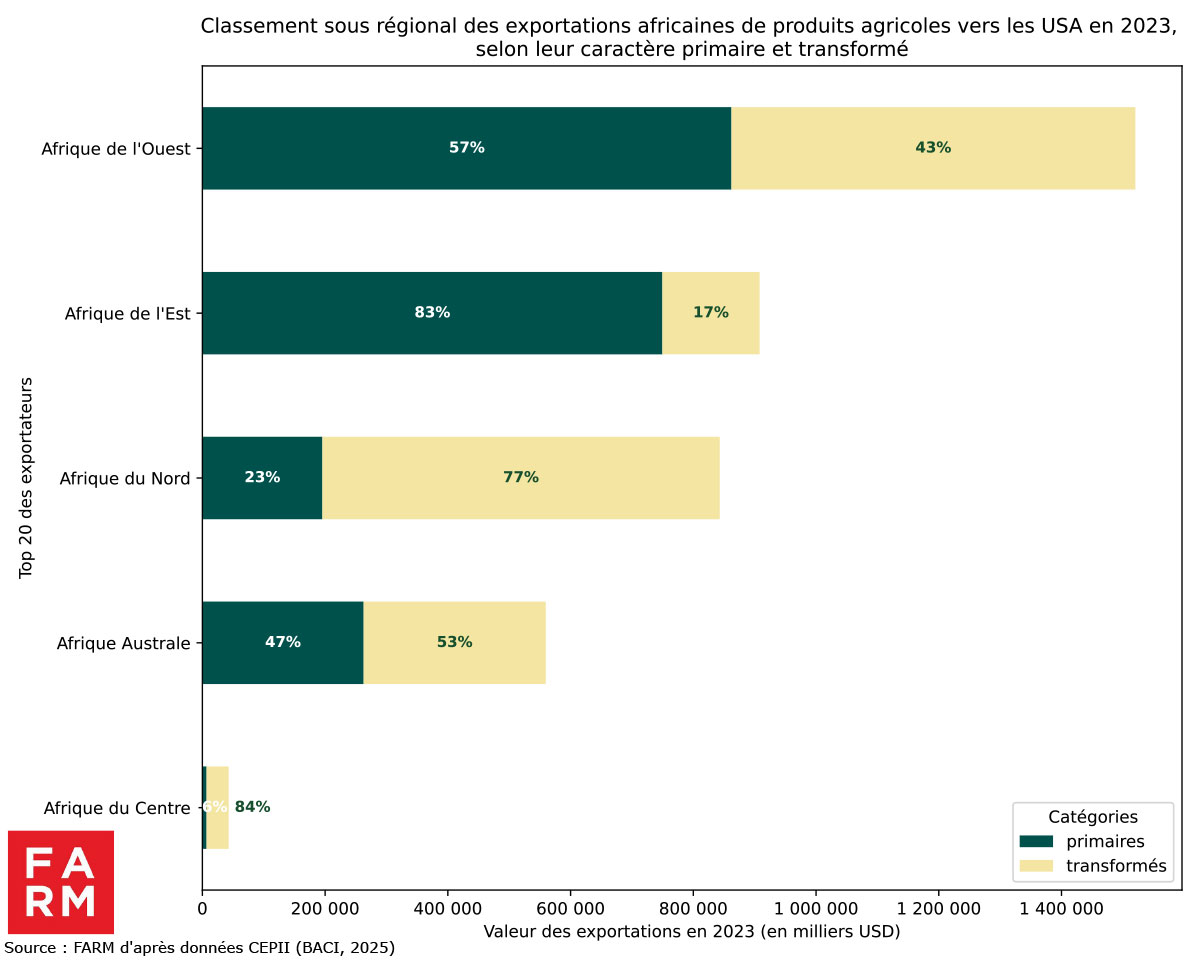
Chart 12: Main African exporters to the USA, by product edibility over the periods 2012 and 2023
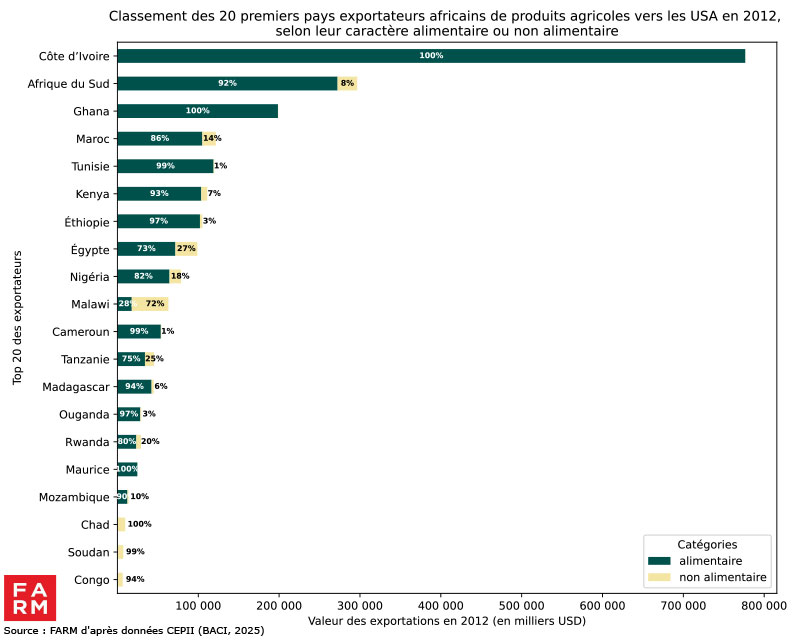
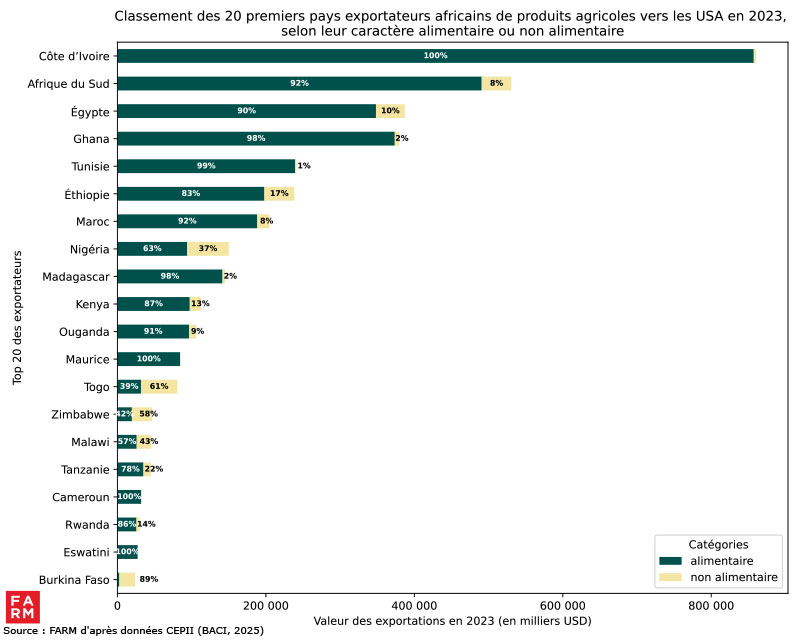
Chart 13: Main African exporters to the USA, by level of product processing over the periods 2012 and 2023
Cocoa, coffee, tea, spices and fruits are the main agricultural products exported to the USA.